Appendix B: Climate Overview
Climate is one of the most obvious driving factors influencing the development and evolution of cultures over the millennia. Global climate influences the abundance and availability of food and shelter, the coastlines and available land area, and overall living conditions that drive migrations, conflicts, and innovation. In contrast with the main chapters of the Book of Turnings, each of which focuses on a single turning, this article highlights the trends and patterns that can be seen across turnings to offer a more longitudinal perspective.
 The initial map that you see represents the world today. It has looked roughly the same for the last four thousand years. Click the left navigation arrow (or swipe rightward) and you will see the world at the peak of the Pagsian Turning in the year 125,000 BP. After that, keep clicking (or swiping) in the same direction to gradually move forward in time and see how the world evolves. Alternatively, clicking or swiping in the opposite direction allows you to watch how the world changes as you travel backward through time.

 You will be able to see correspondences between these graphs and the slideshow of maps. As you browse through the first several slides, for example, starting from the peak of the Pagsian Turning (125,000 BP) through to the end of the Ougrosian Turning (64,560 BP), you will be able to visualize the increase in glacier cover and expansion of dry land area that correspond to the falling temperature and sea level lines on the graphs.

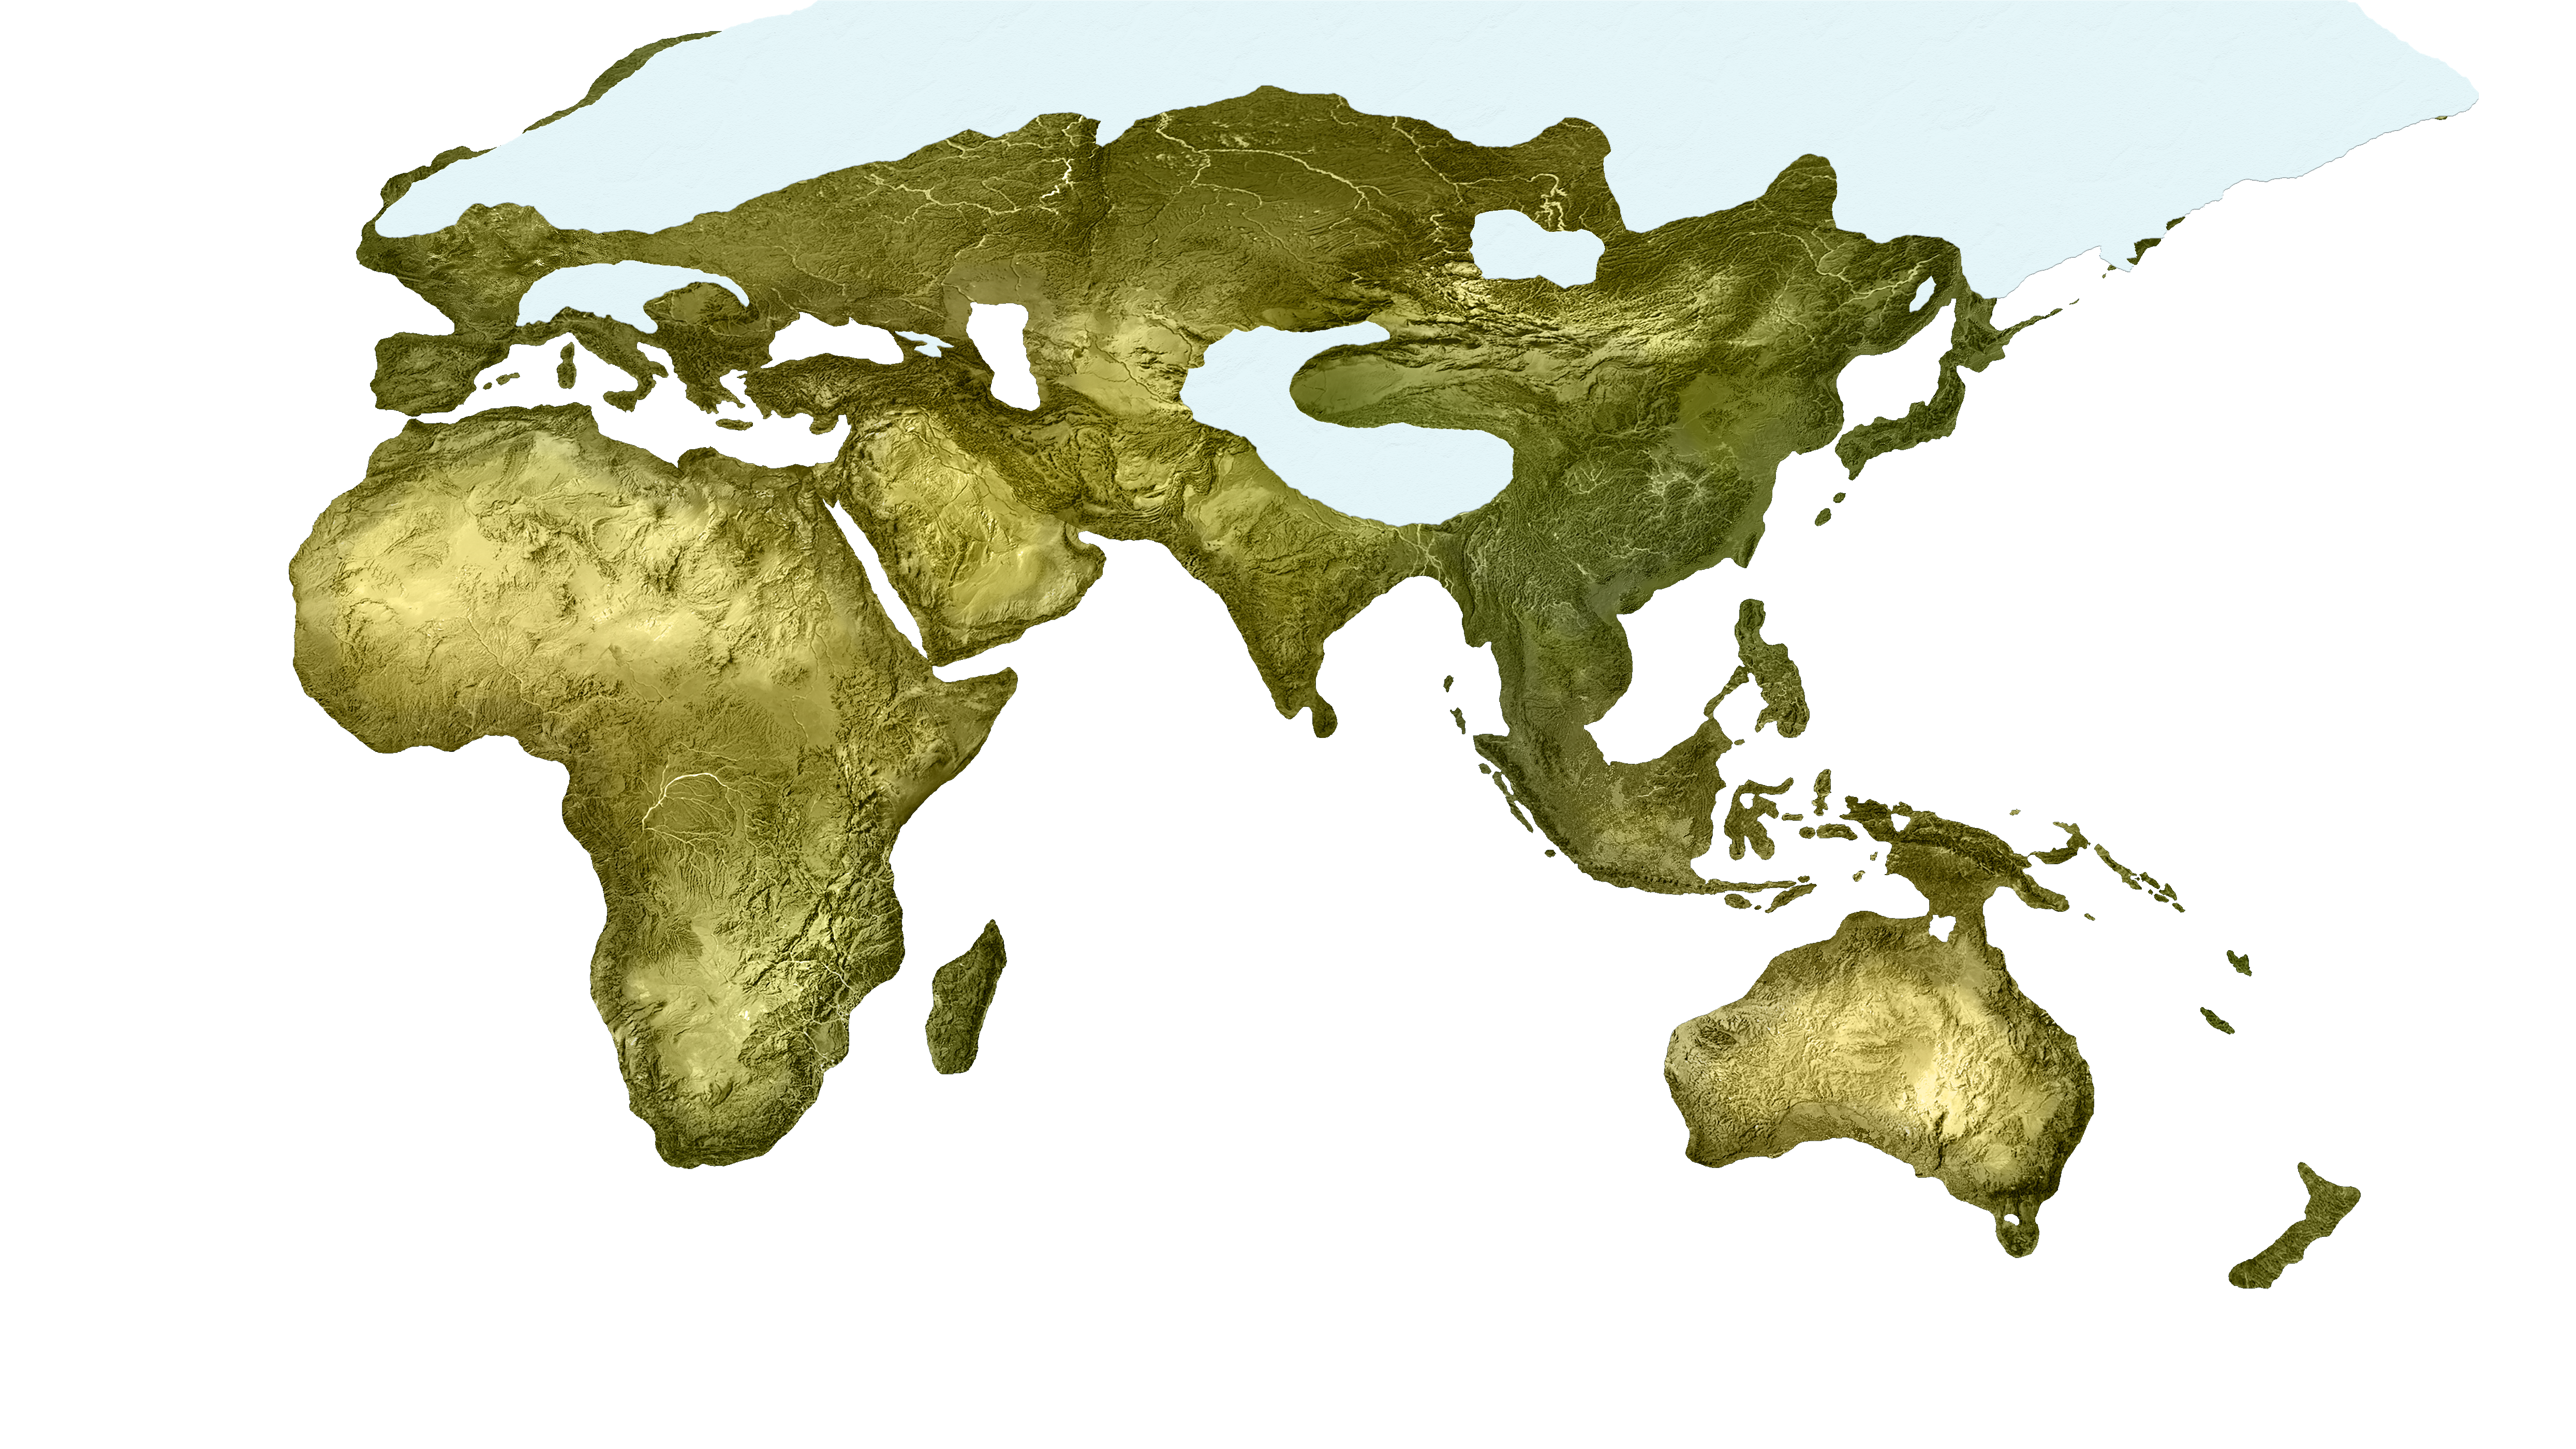
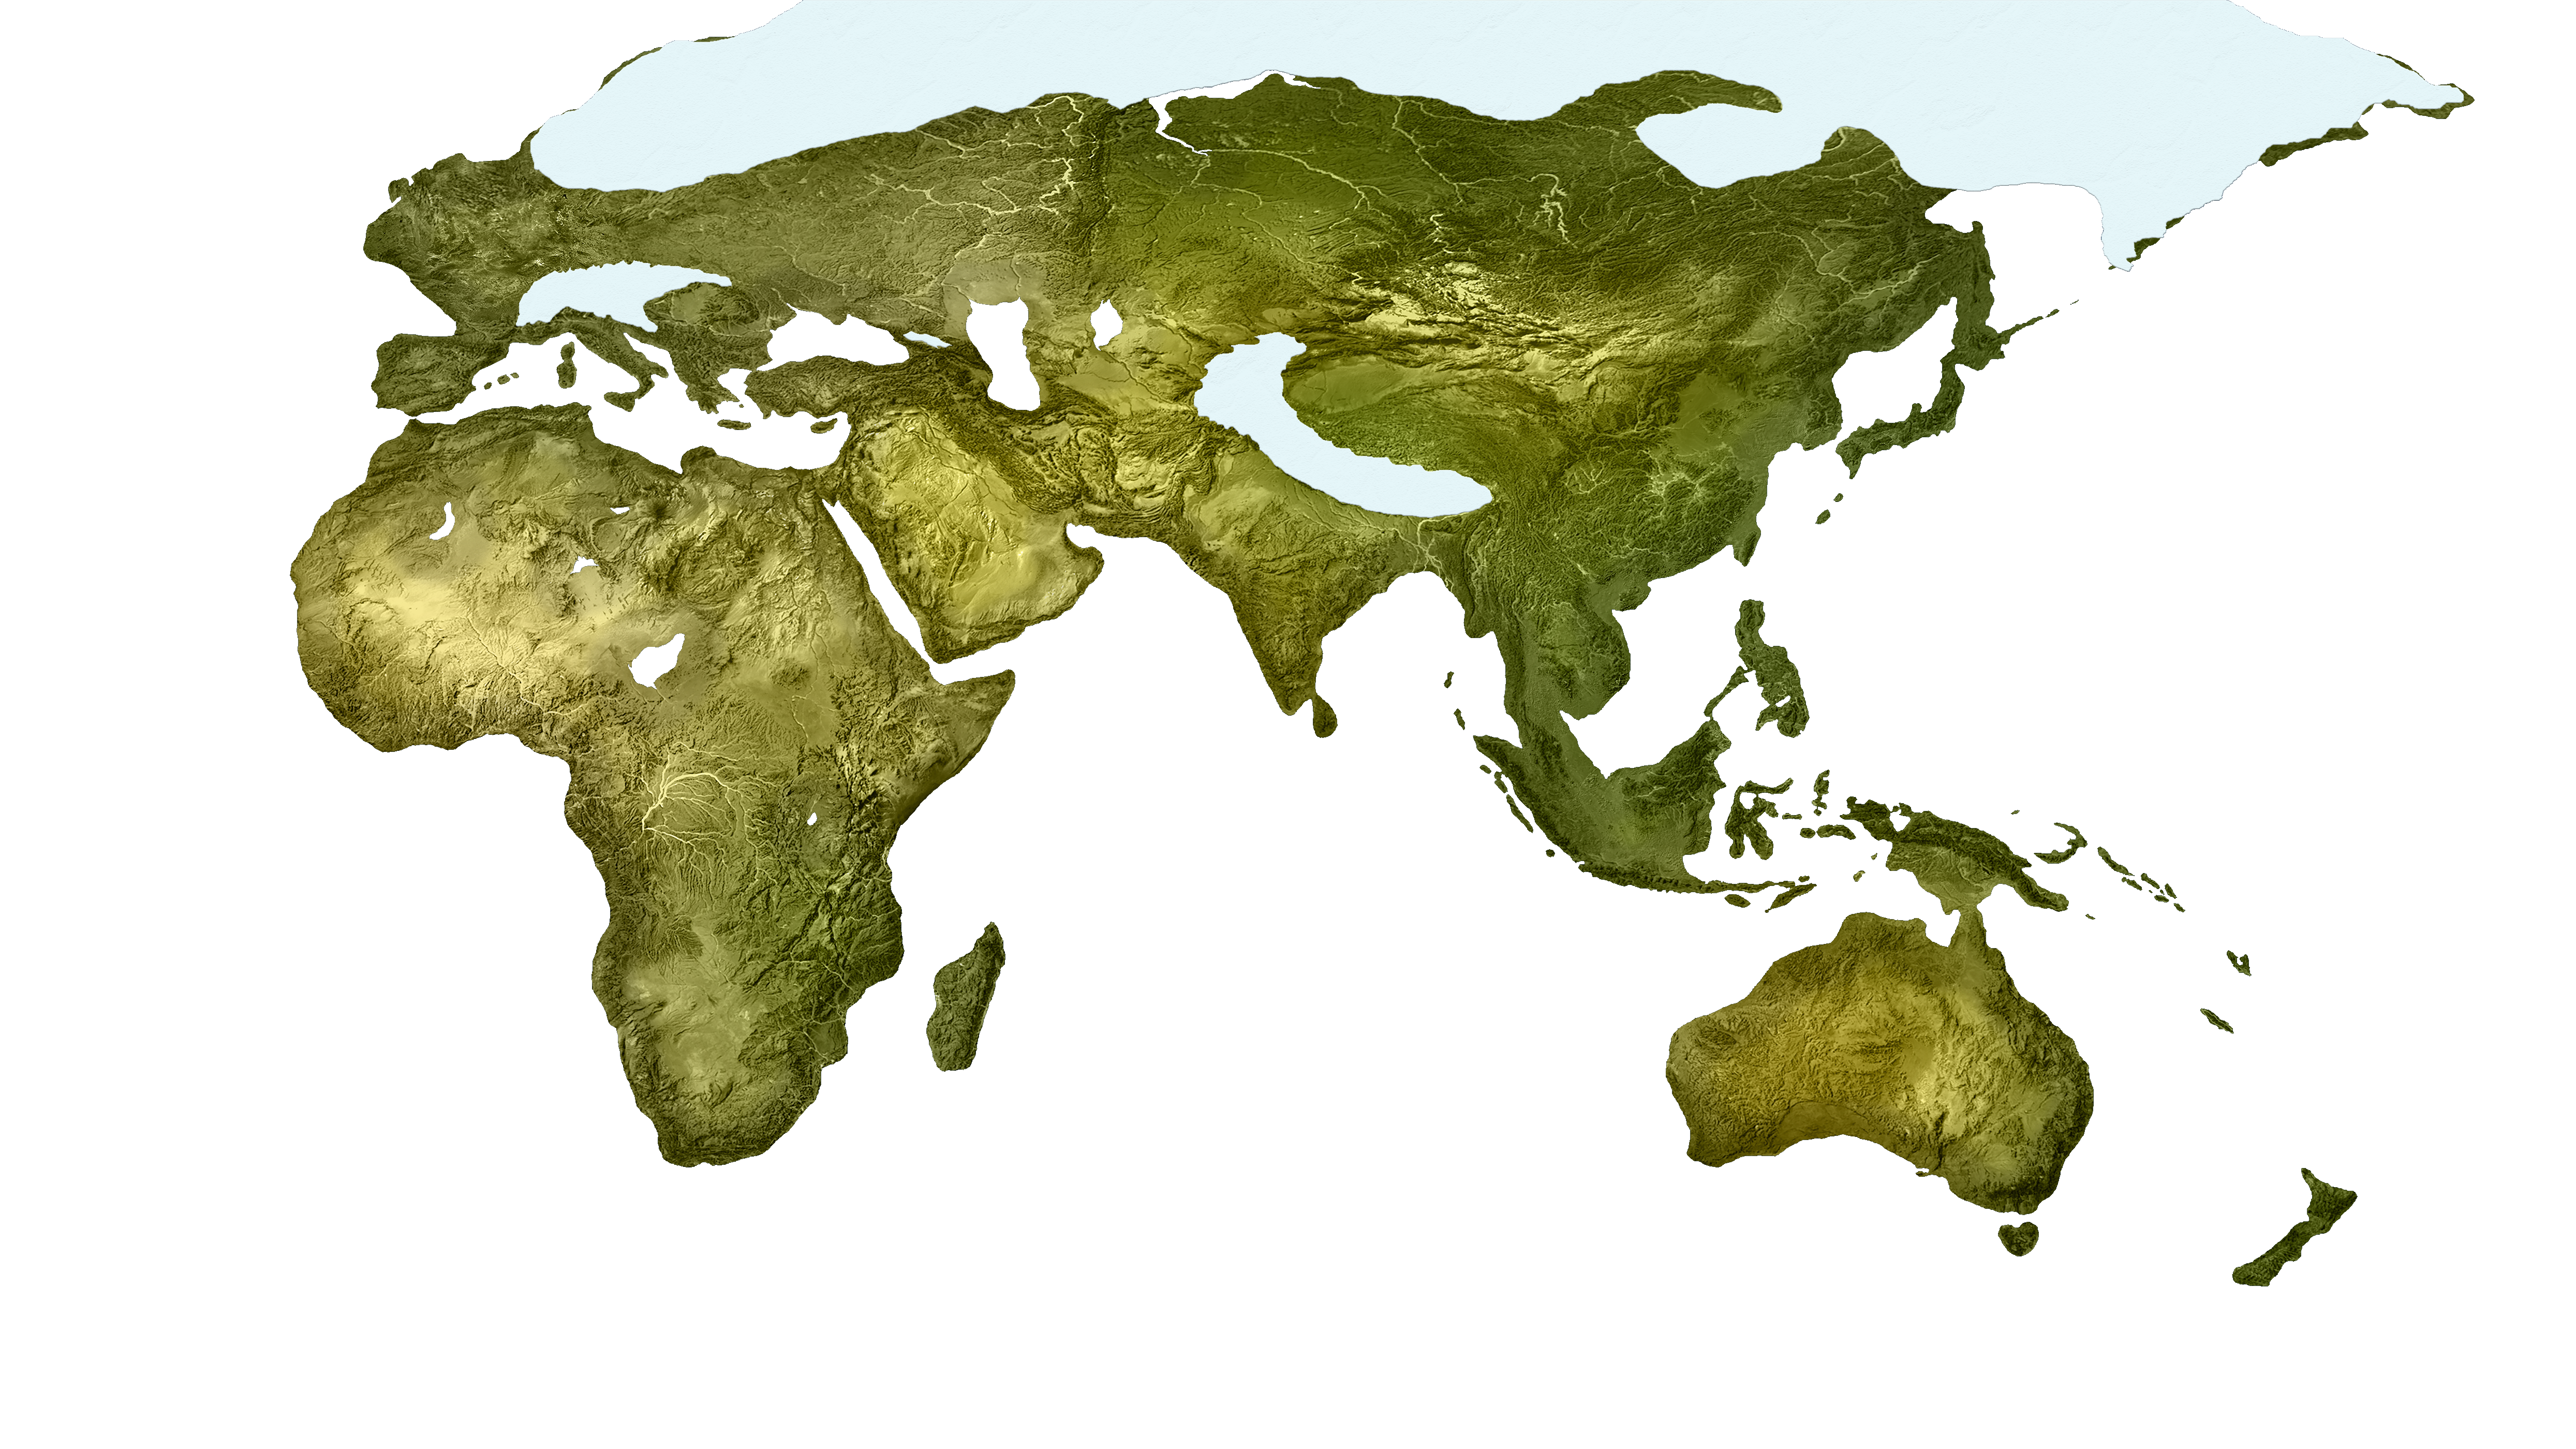
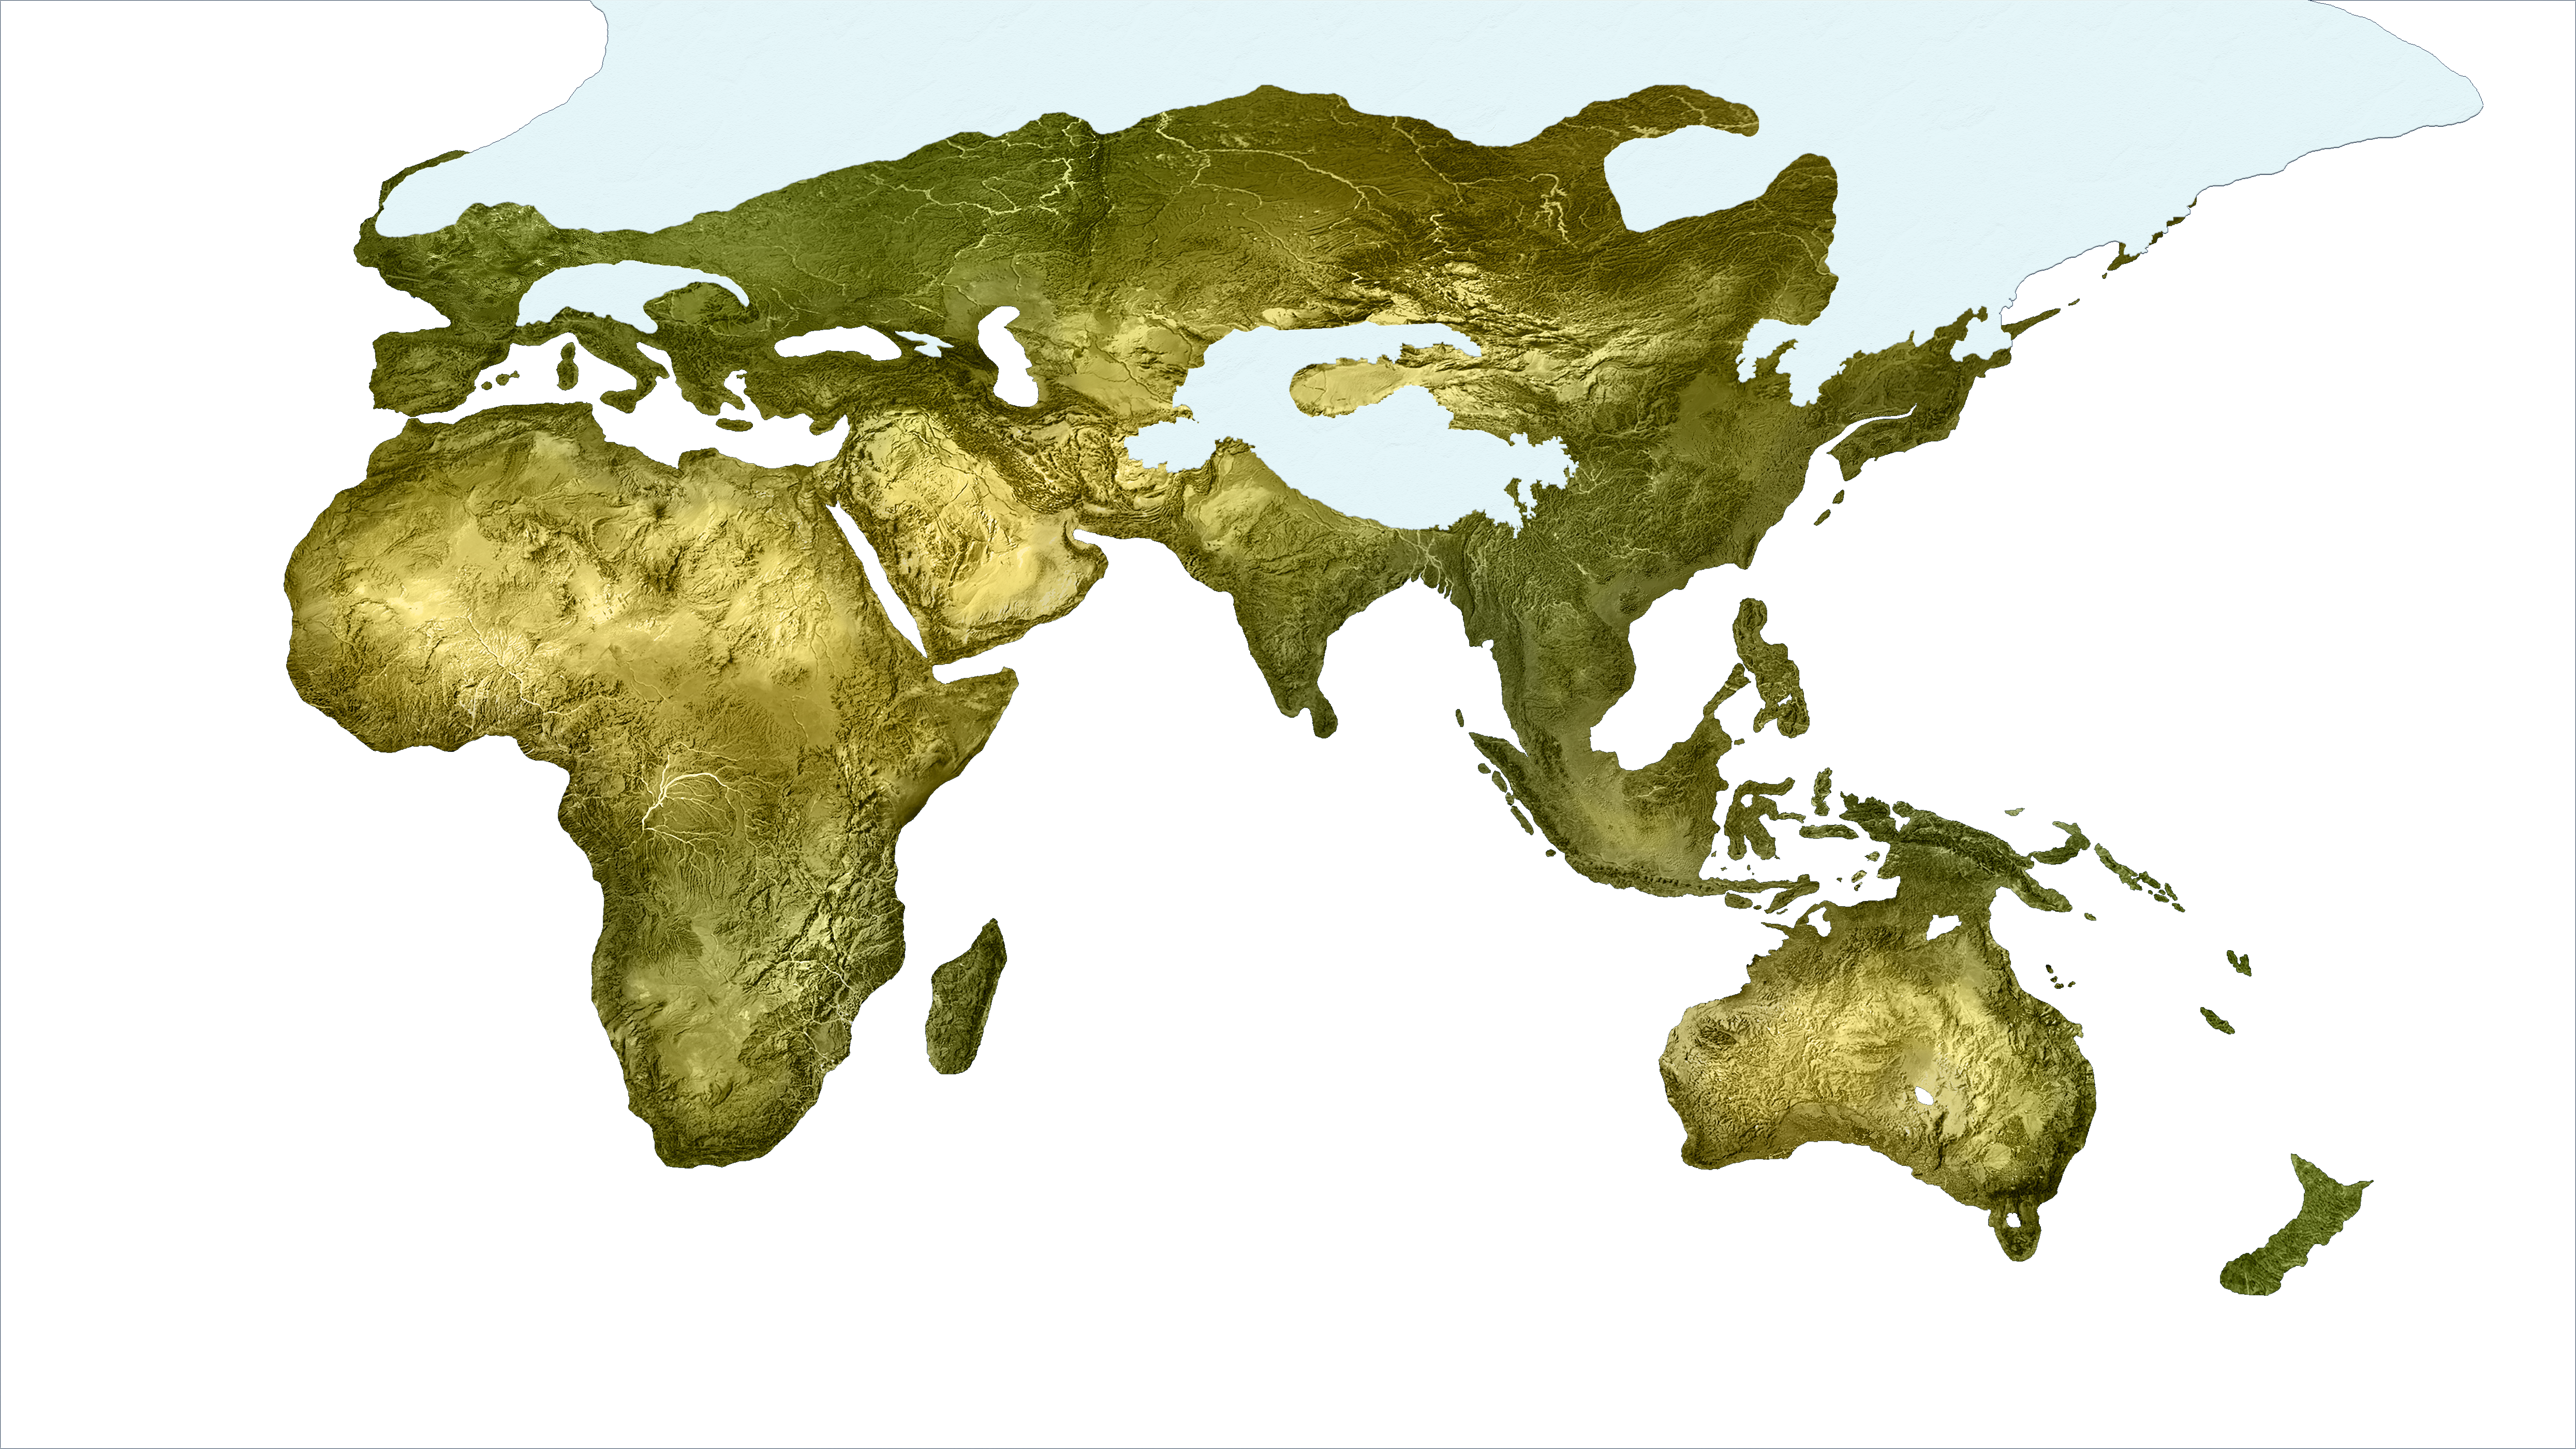
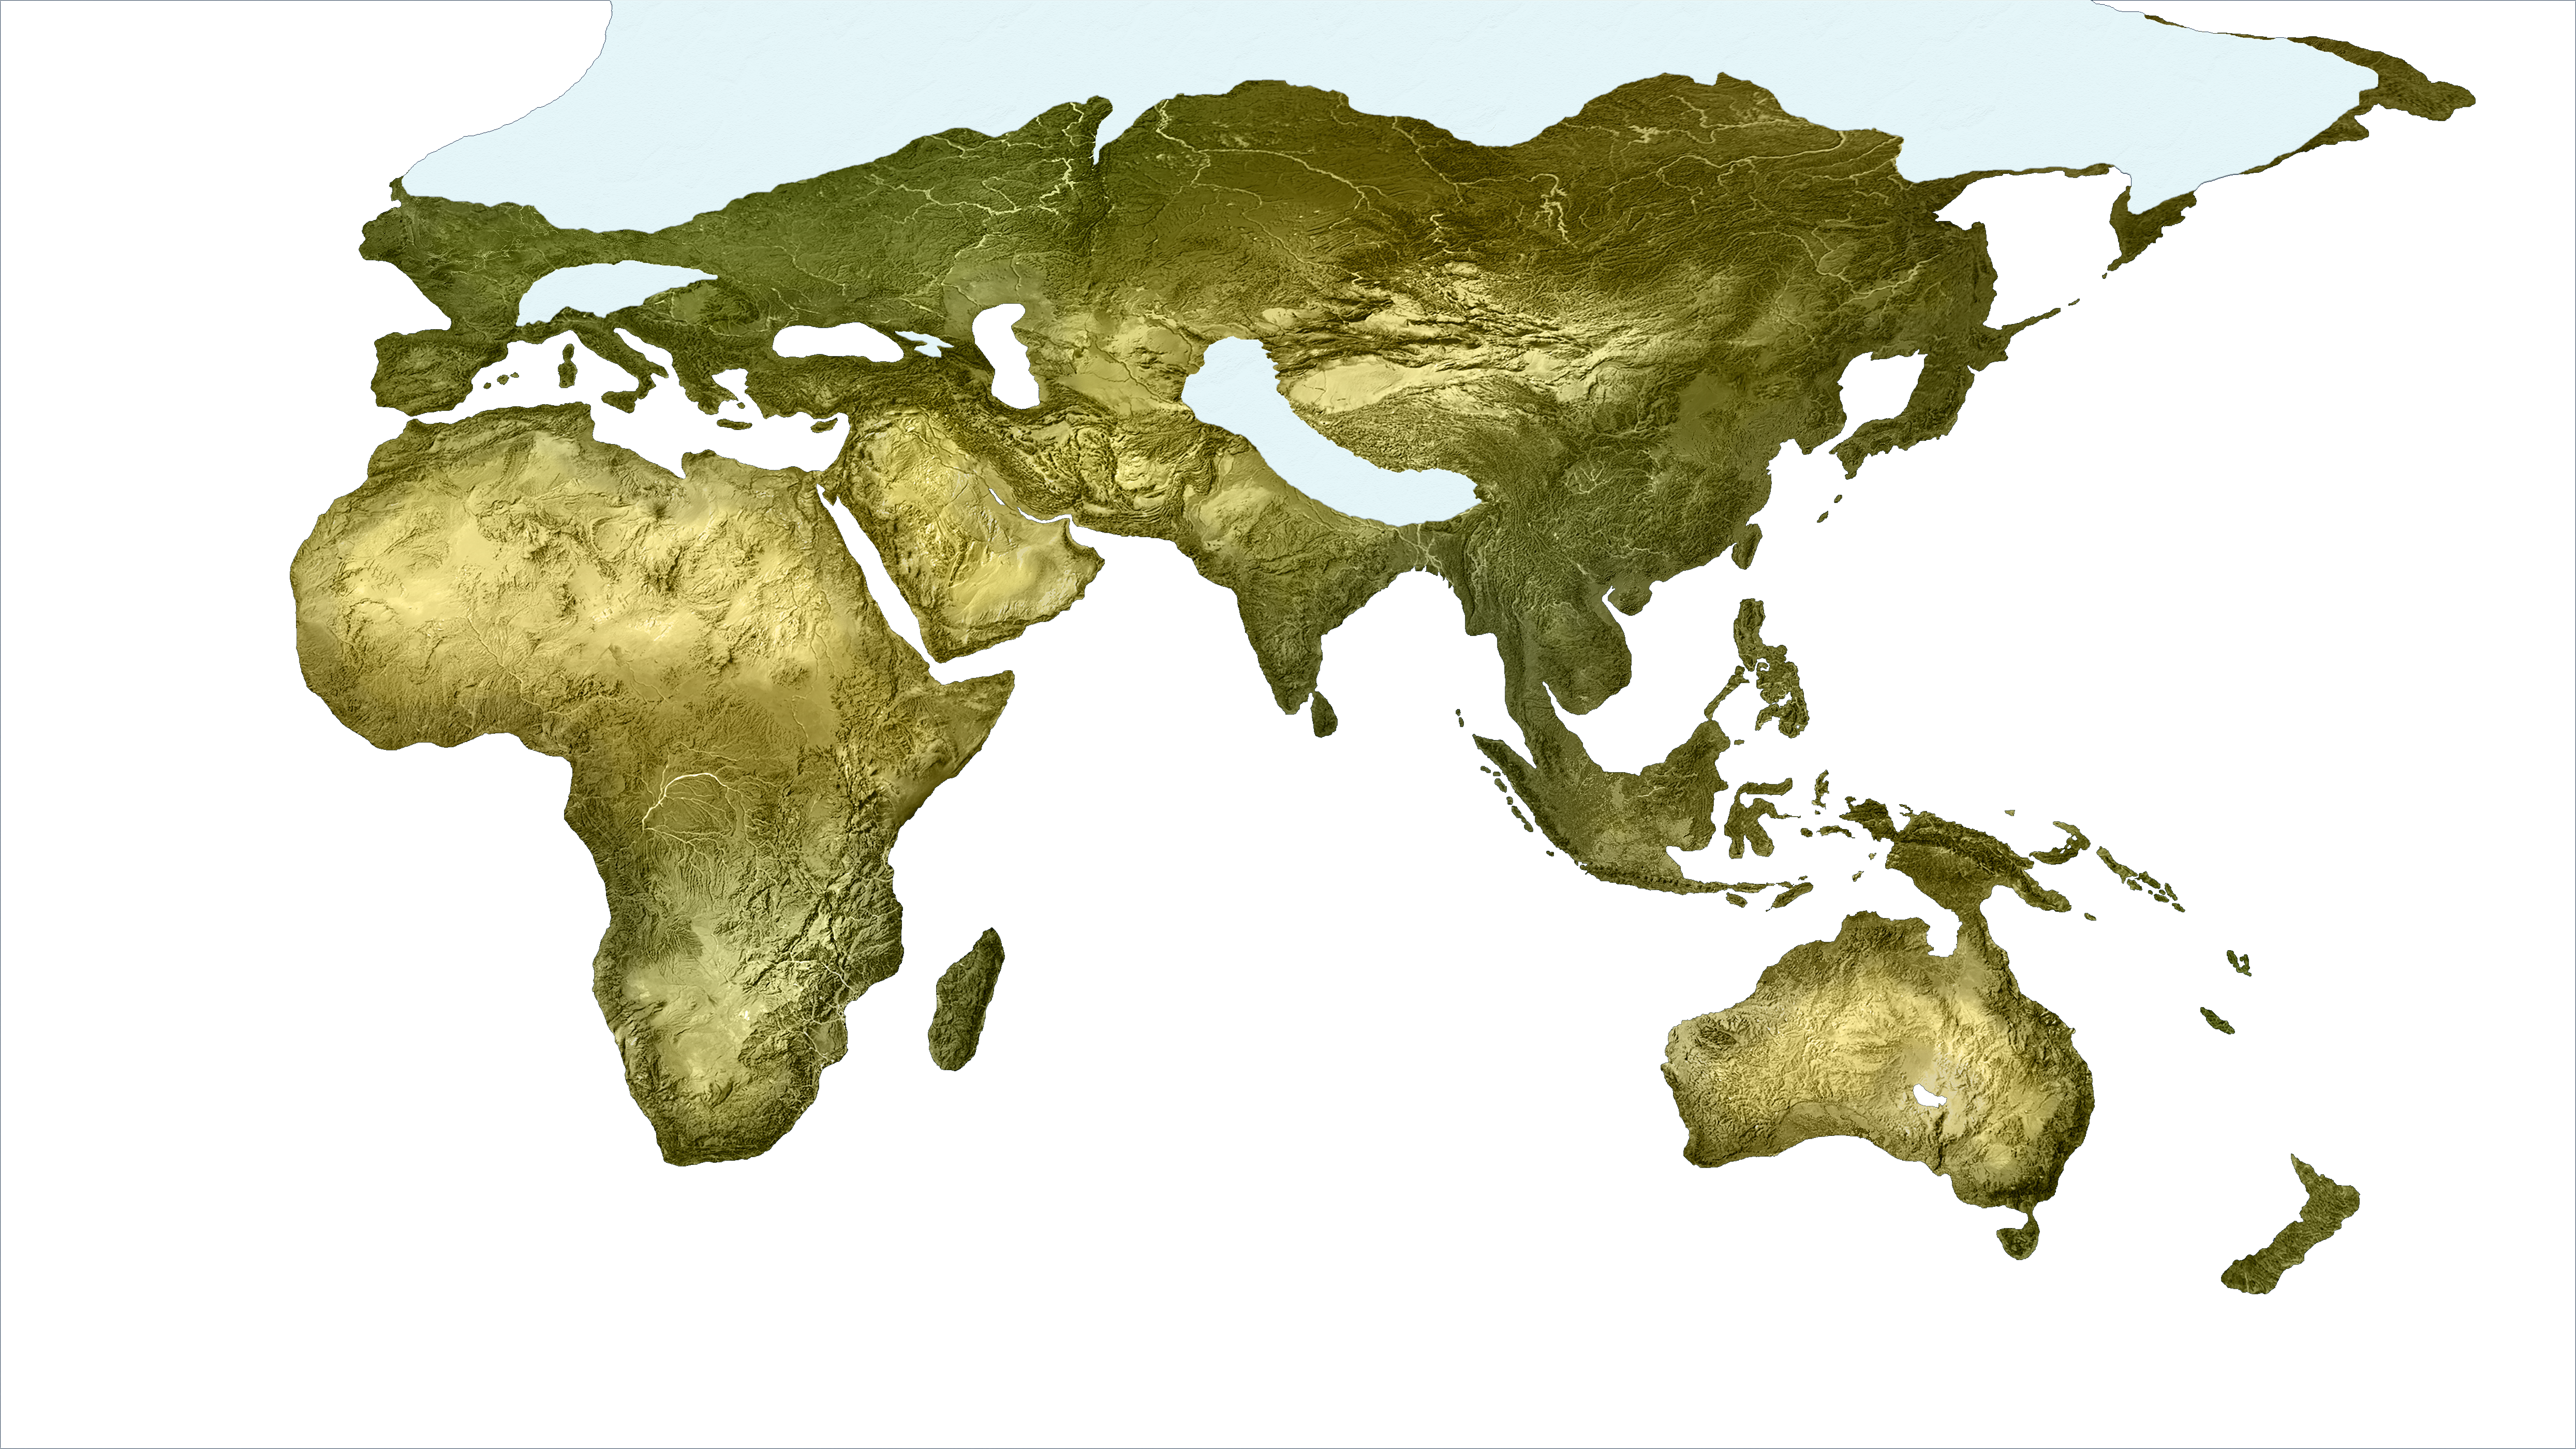
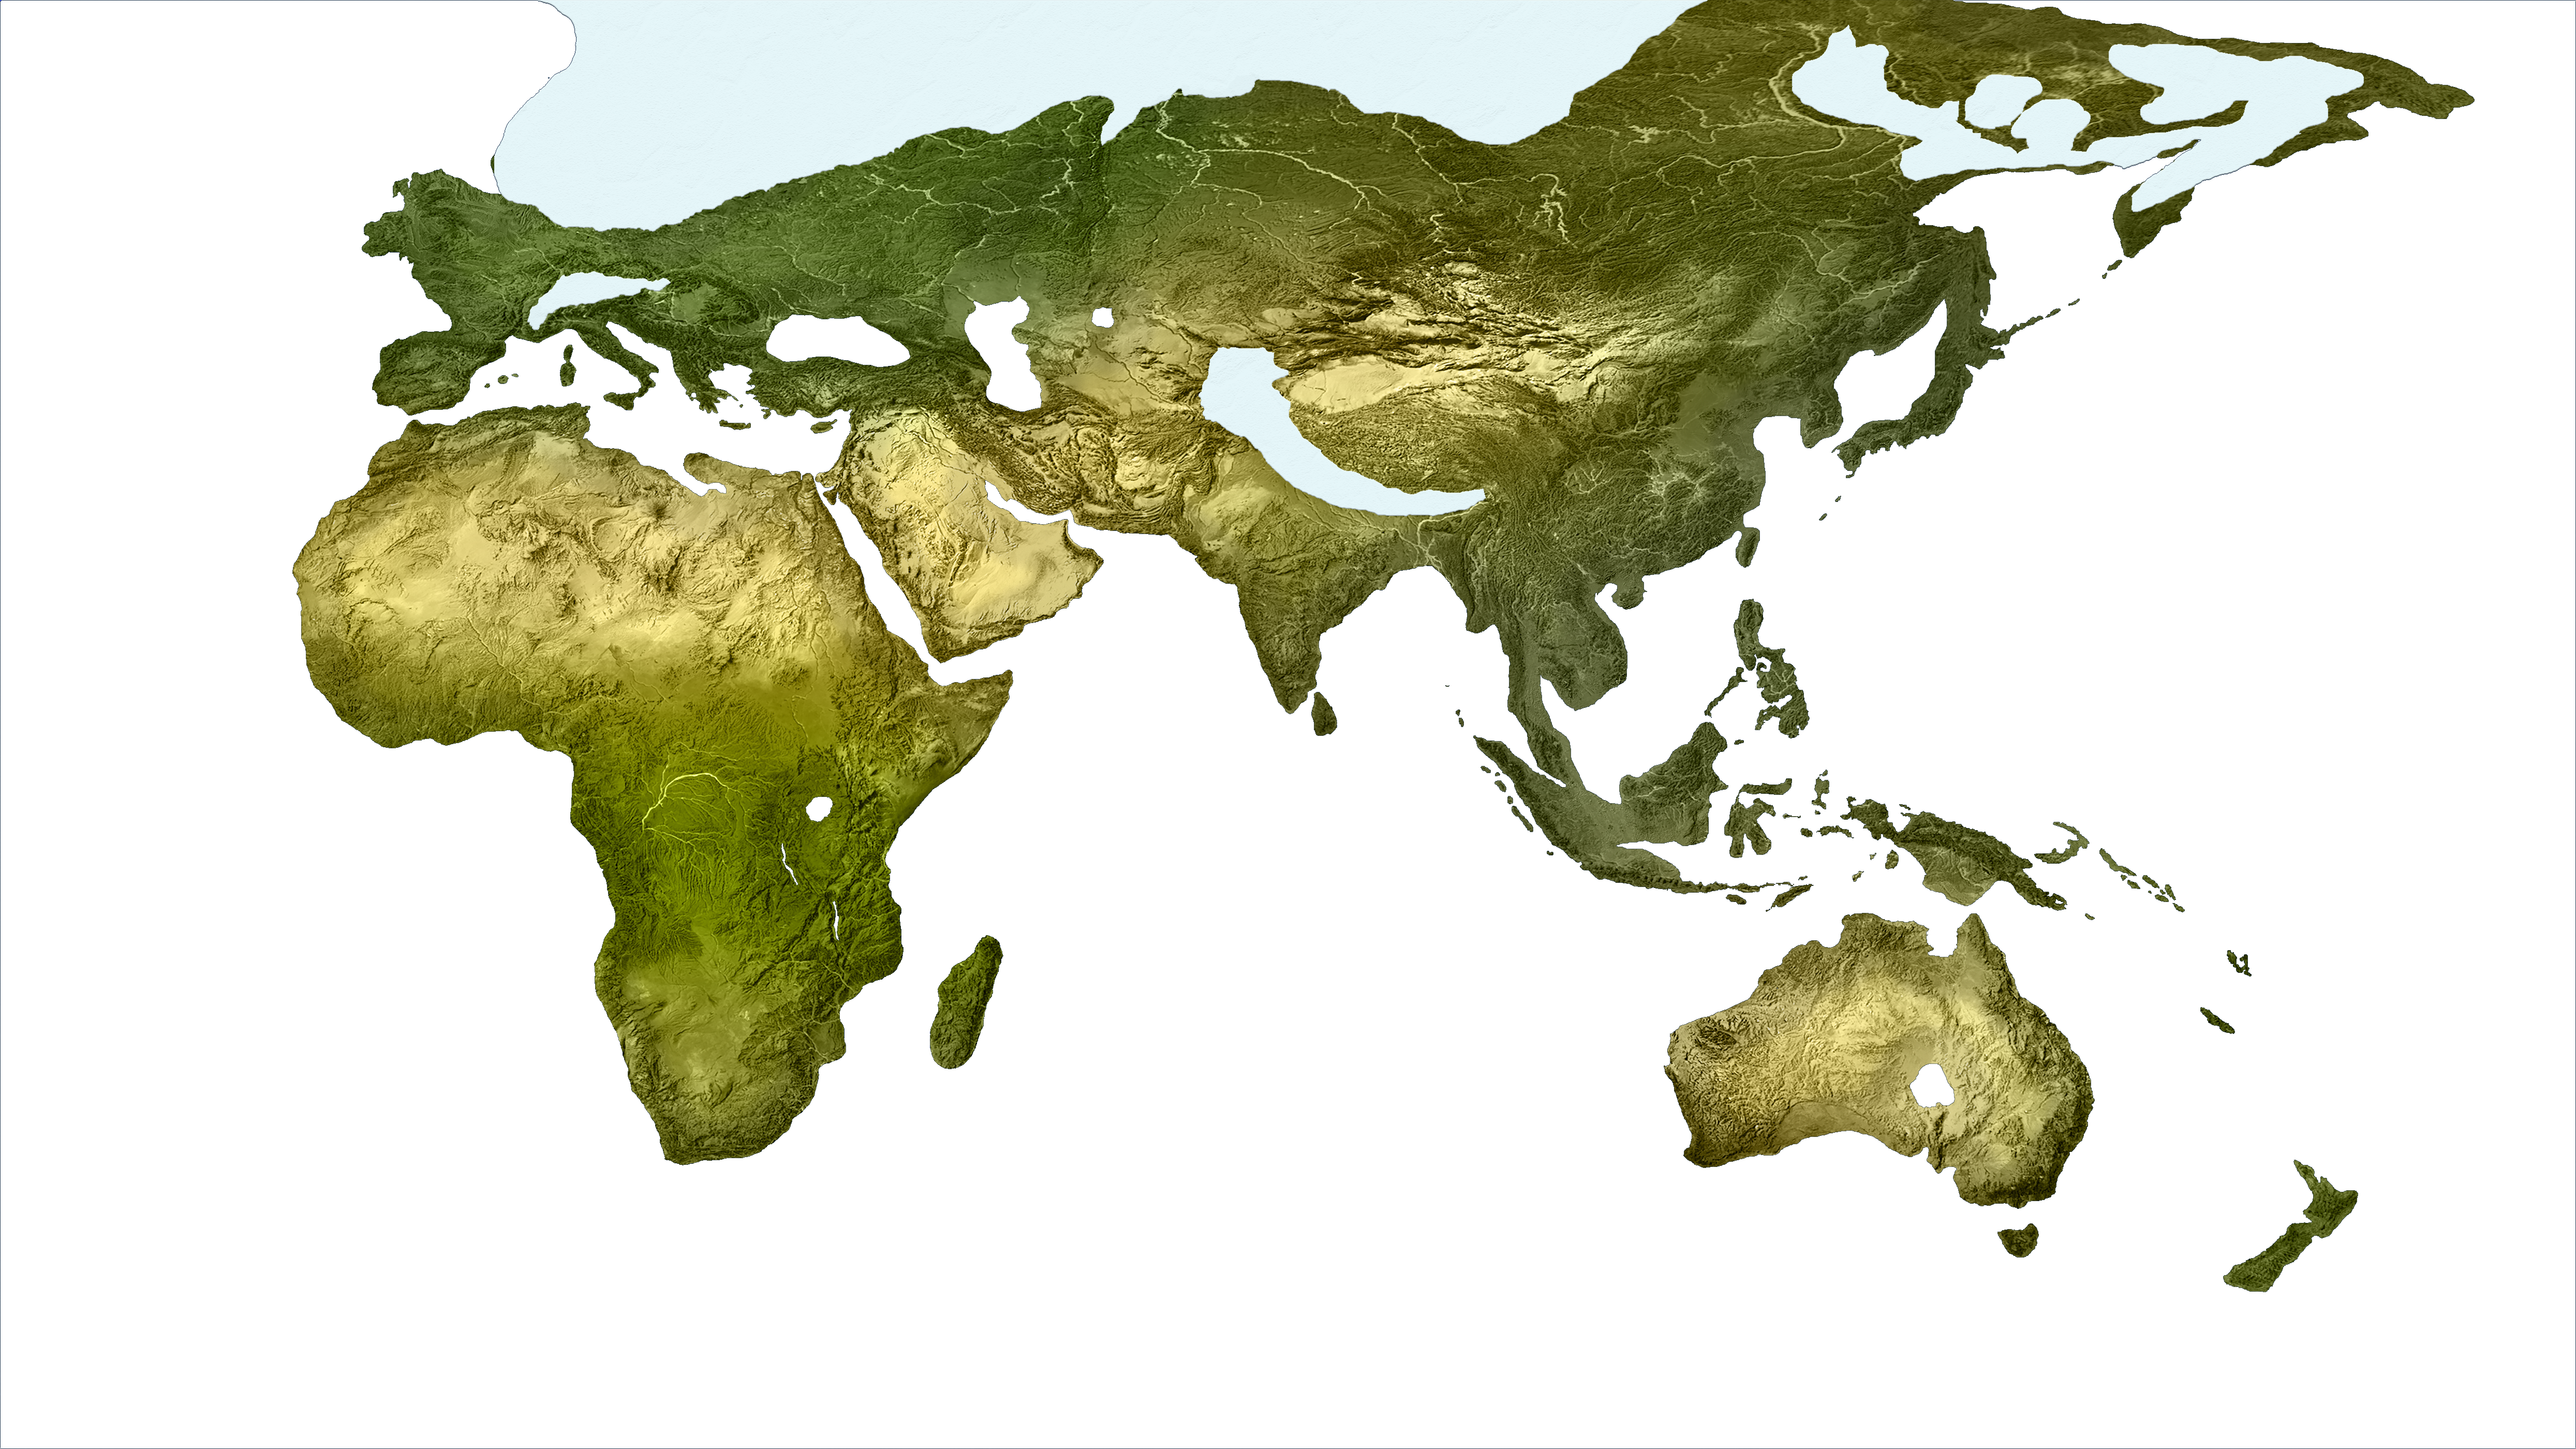
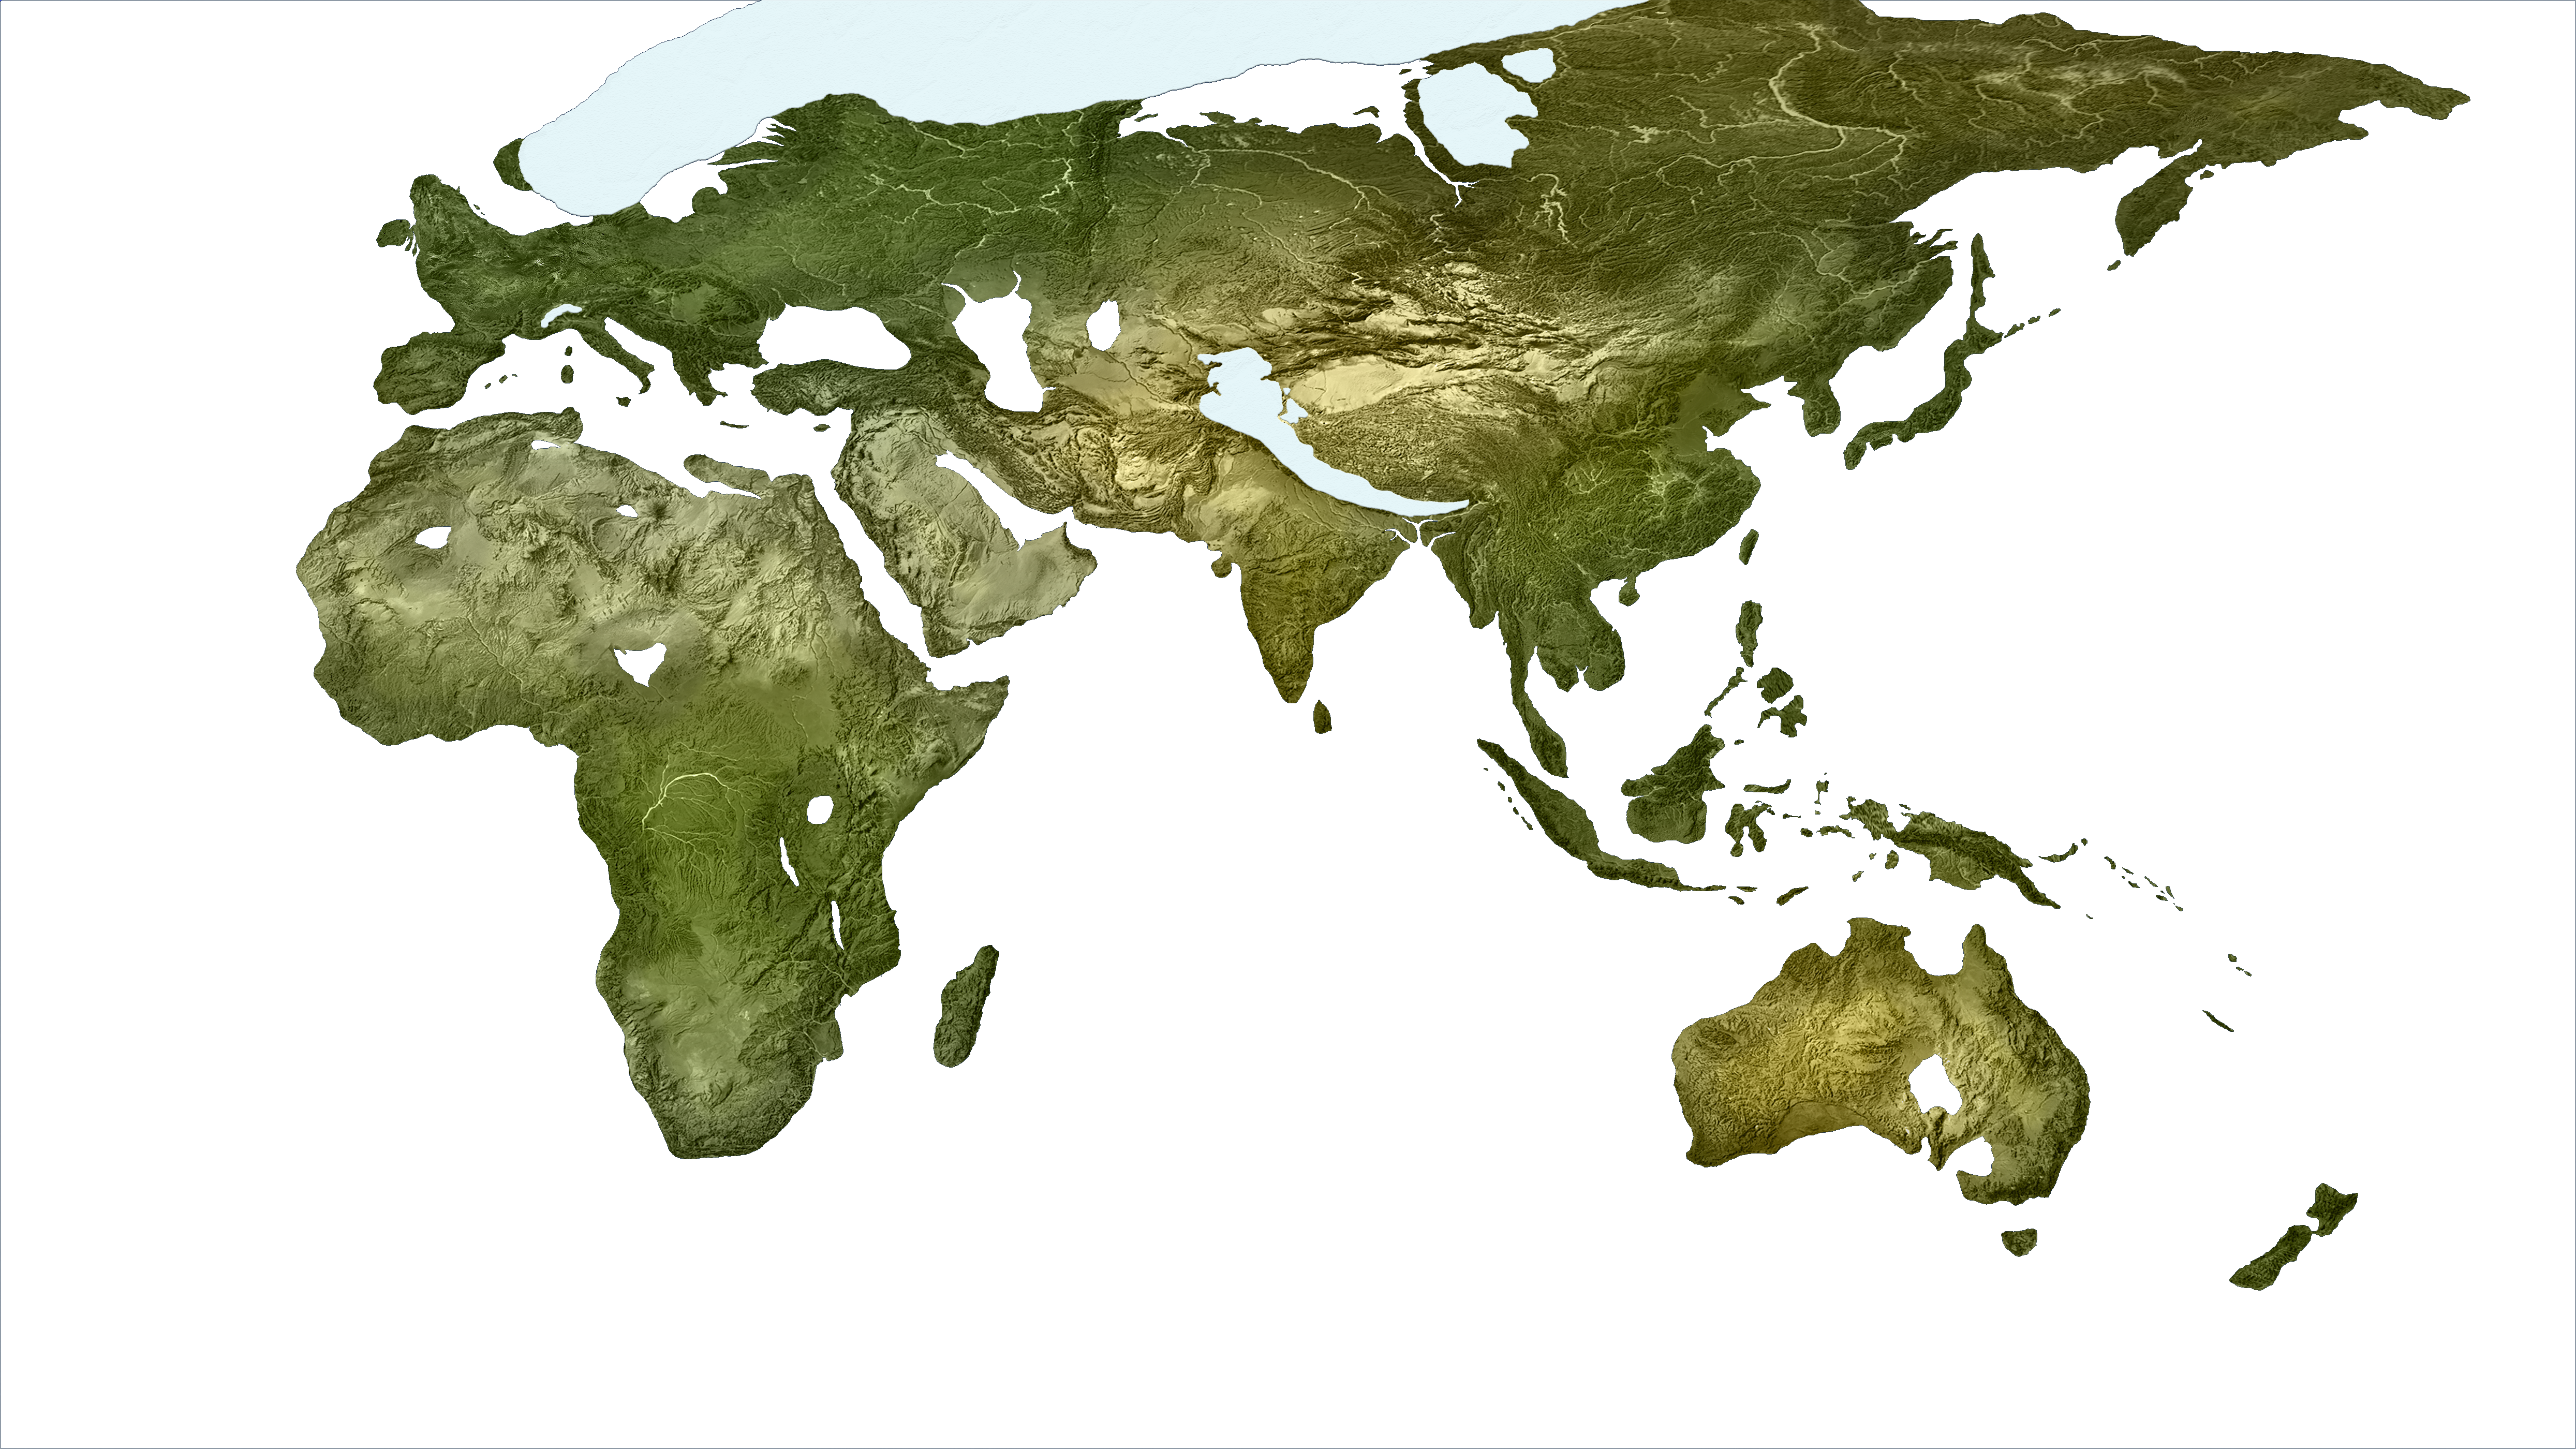
 By contrast, starting with the Second Tādhēskō rising temperatures caused sea levels to rise more or less continuously rise until the middle of Polwes Pleudō (shown in the first map) and again from the middle of Polwes Pleudō until the start of the Meghalaian Turning (shown in the second map). In each of these maps, sea level is rising and land area is decreasing. Therefore, the color-coded bands should be interpreted in the opposite way from the previous maps. In the maps below, the color-coded bands represent land area that was incrementally lost over time, moving inward from the initial largest area shown.

 It is important to note that changes in global sea level do not always have a uniform global effect on coastlines everywhere in the world. Differences in weather, erosion patterns, and shifting of the earth's crust due to isostatic reactions to the changing weight of glaciers all produce interesting anomalies in the evolution of coastlines over time. One of the most clear illustrations of this can be seen in coastline development in northern Europe across the Paukos Eisom and Polwes Pleudō turnings.
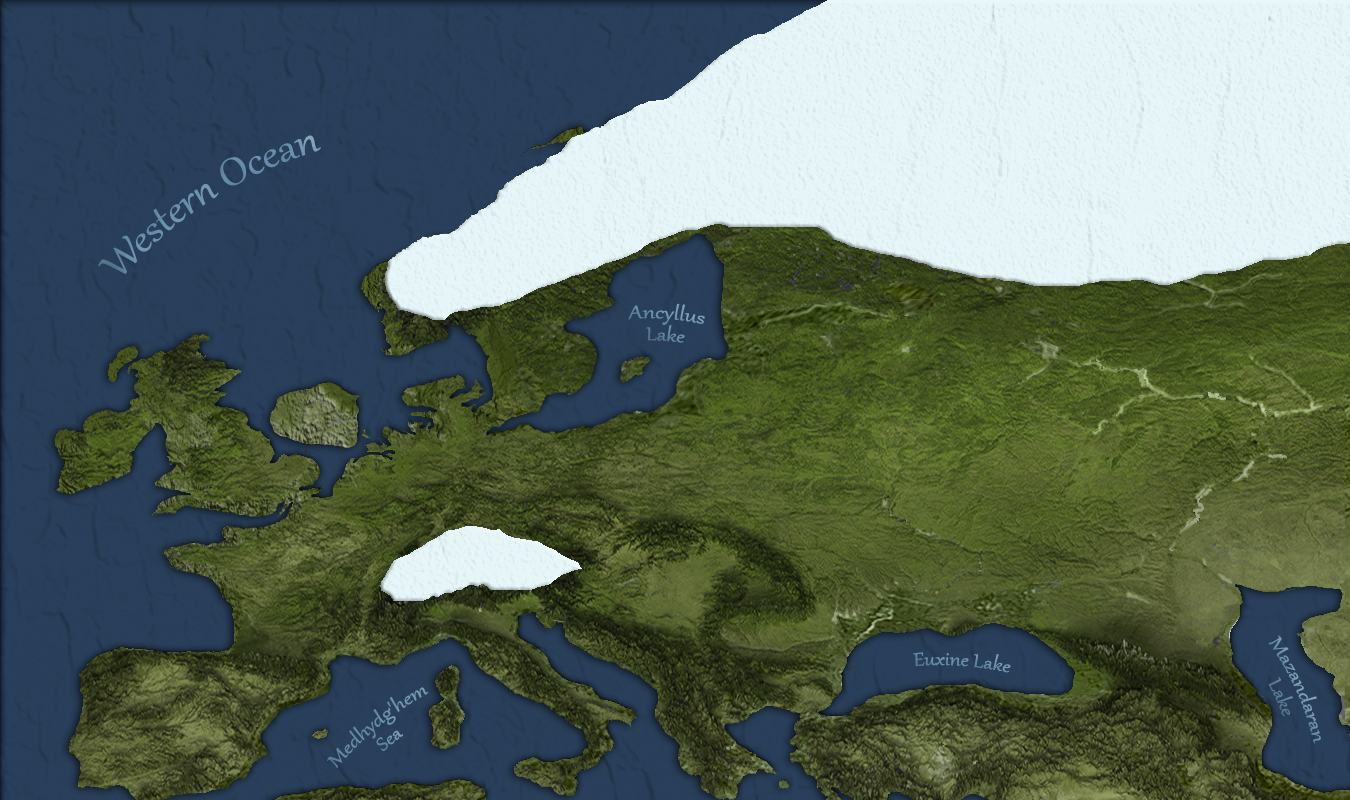
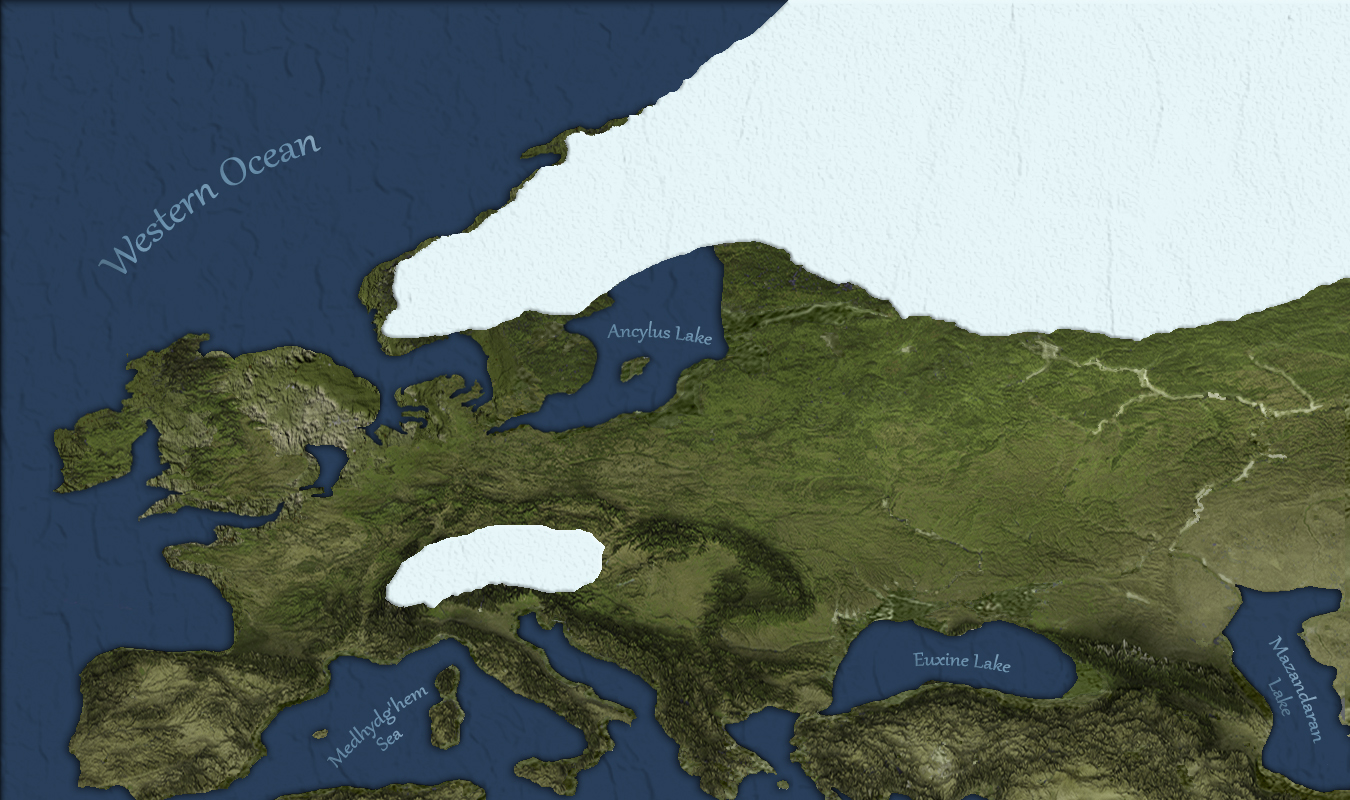
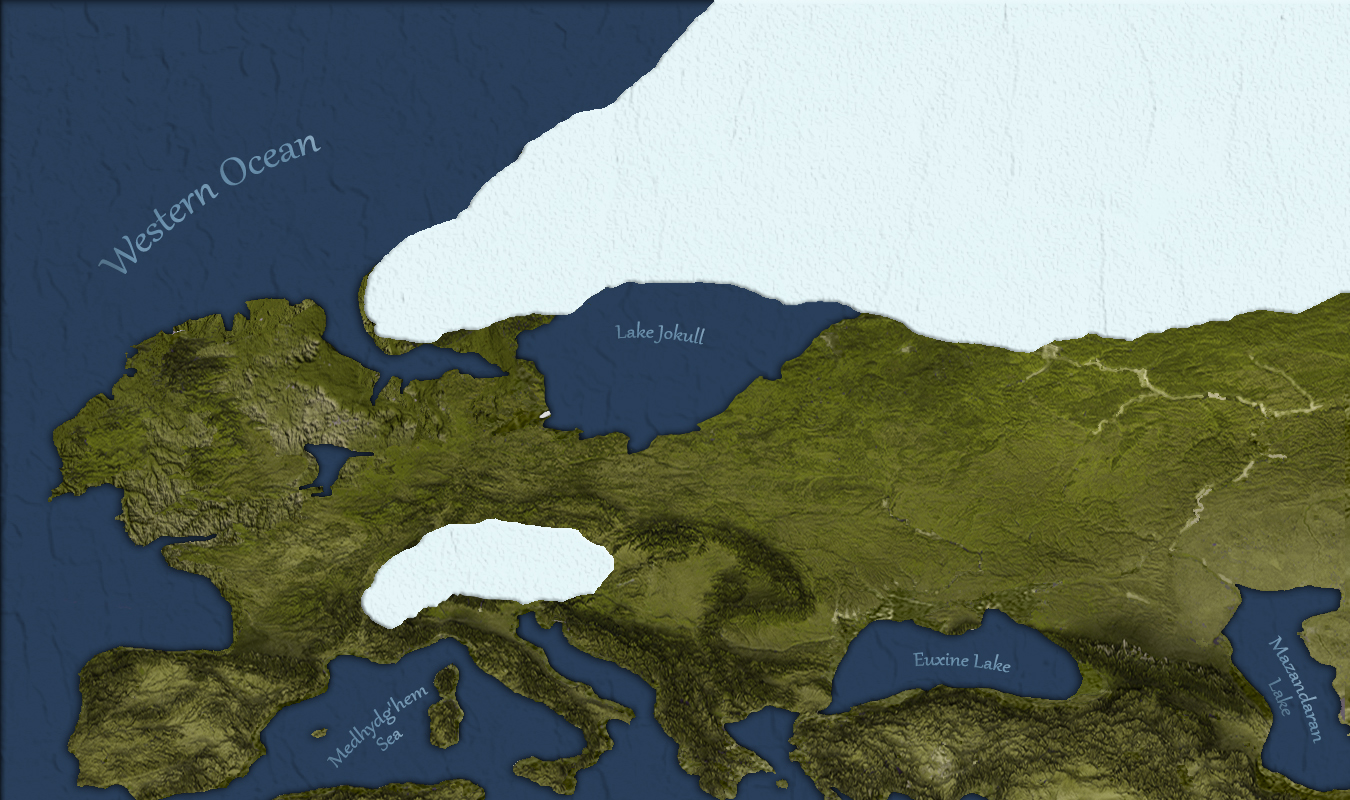
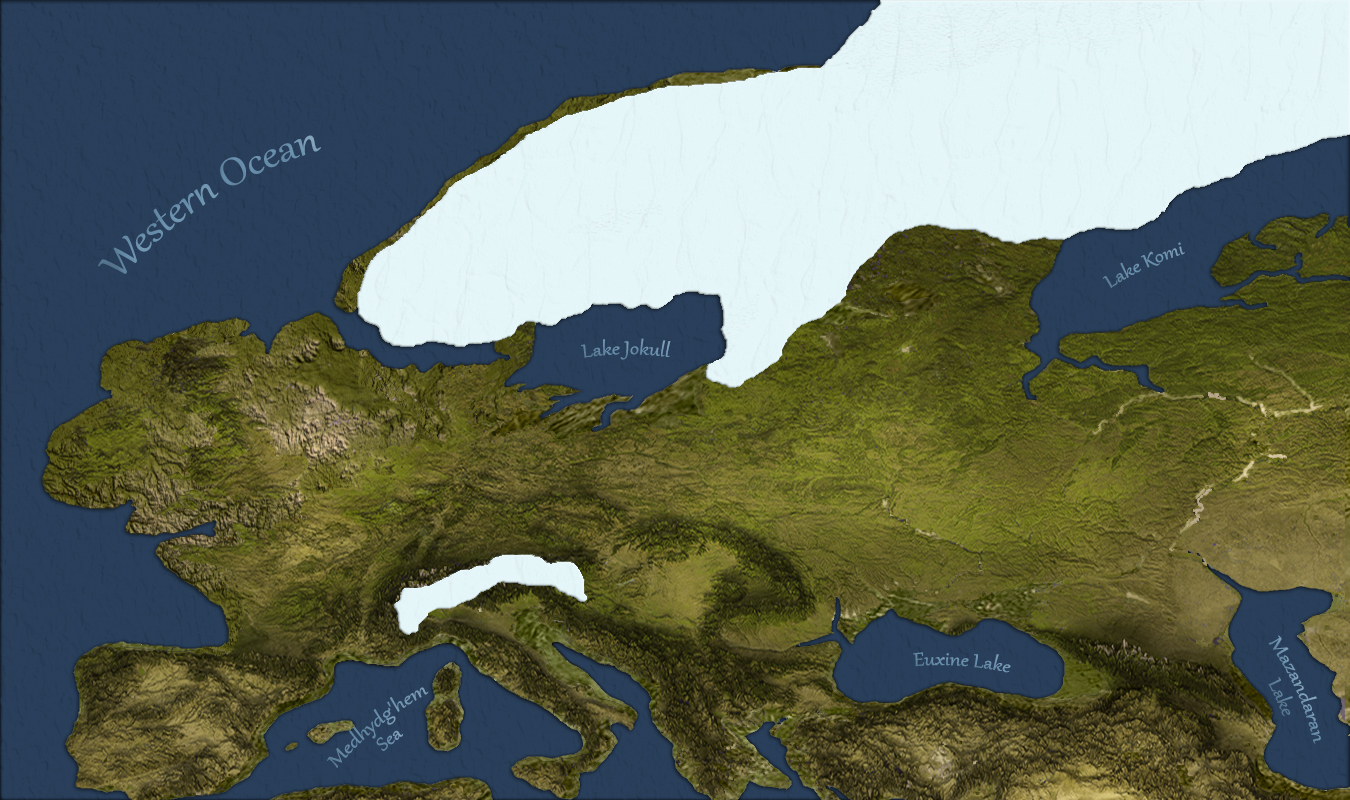 When Paukos Eisom began, Lake Jokull was a massive icewater lake separating Skáney from Variscides, shown in the first slide (A) above. Before the lake could rise high enough to break through the land barrier to the sea, however, the volcanic eruption at Laacher See in southern Variscides brought the Second Tādhēskō to a sudden halt in Europe. The explosion flattened all vegetation in a five kilometer radius, and threw a cloud of ash and sulfur into the atmosphere that was so dense it threw Europe into Paukos Eisom. Glaciers once more covered Skáney, as shown in the second slide (B).
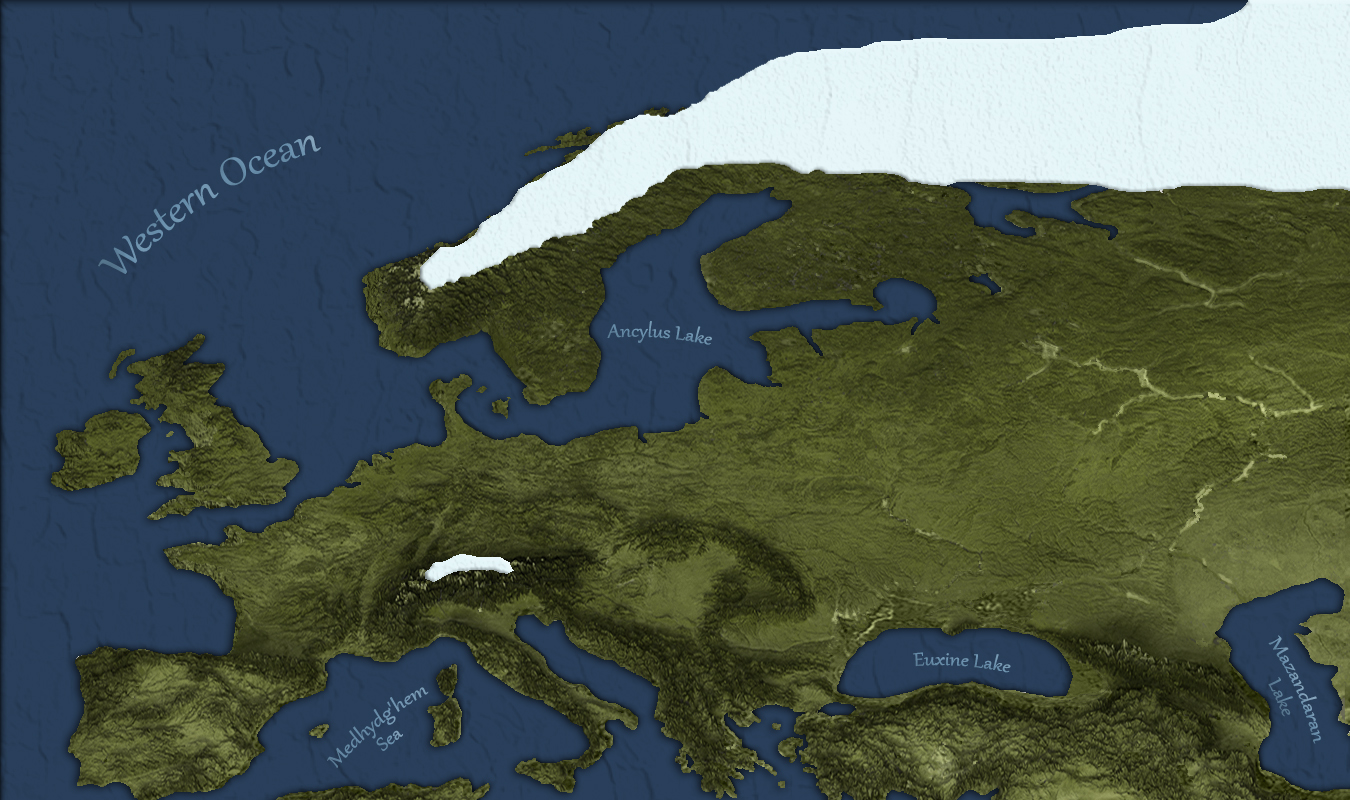
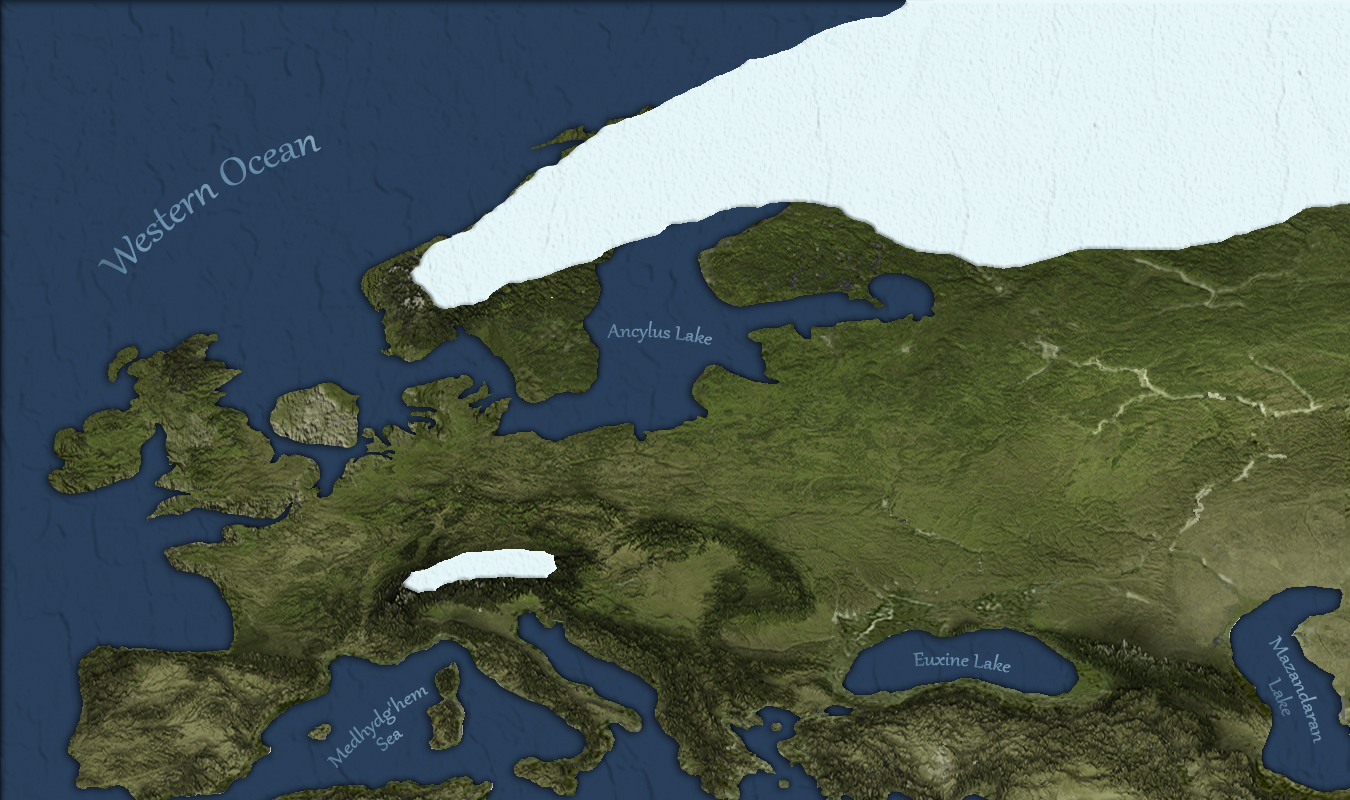
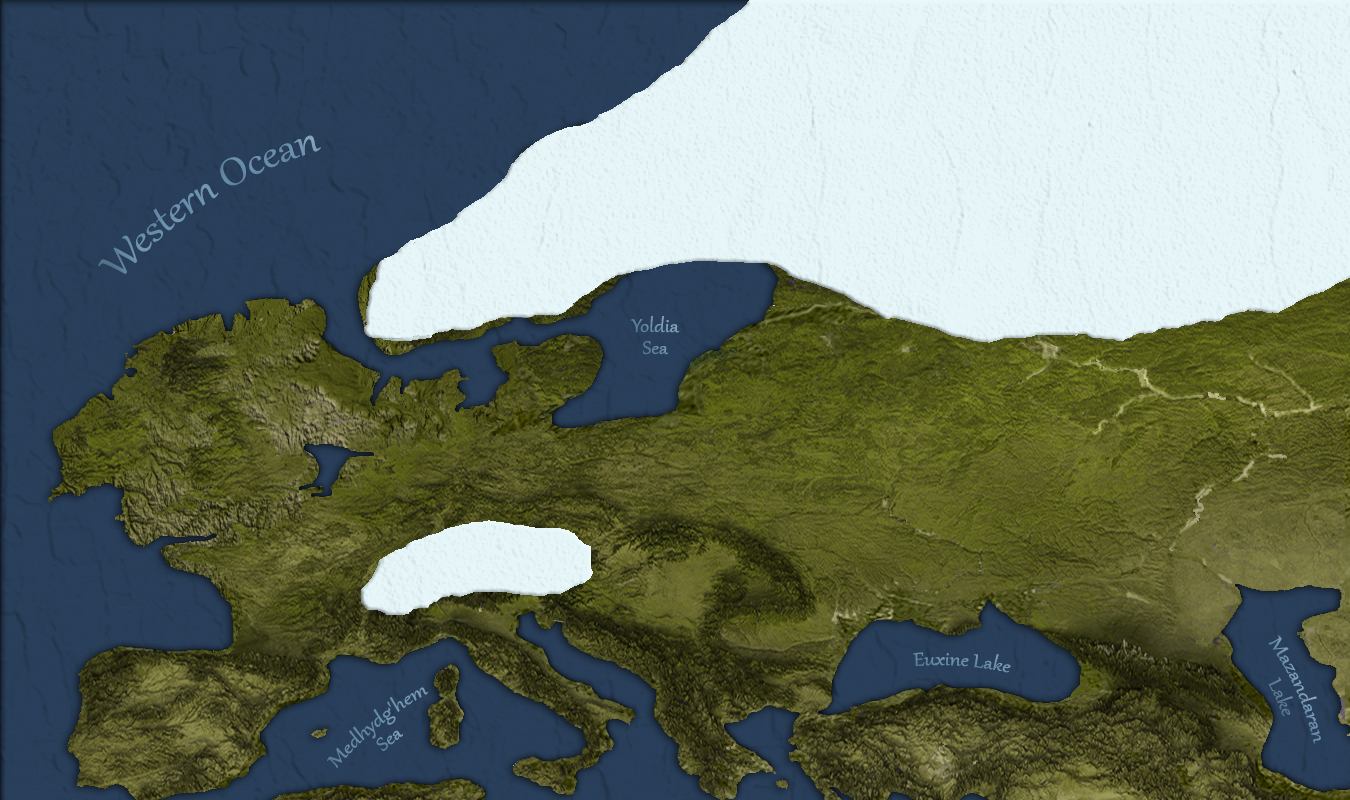
Eventually the atmospheric ash cleared and the climate rebounded, so that Lake Jokull formed once again, shown in slide (C). The water rose more rapidly this time, and erosian patterns had altered the underlying land, so land barrier that had separated it from the ocean was breeched. The water drained into the ocean, leaving a much smaller body of water that was Yoldia Sea, shown in slide (D). Although ocean levels continued to rise, leading to Daganzi becoming an island, isostatic uplift also caused the land to shift and rise, so that Yoldia Sea became cut off from the ocean and it was transformed into the saltwater Ancylus Lake, shown in slide (E).
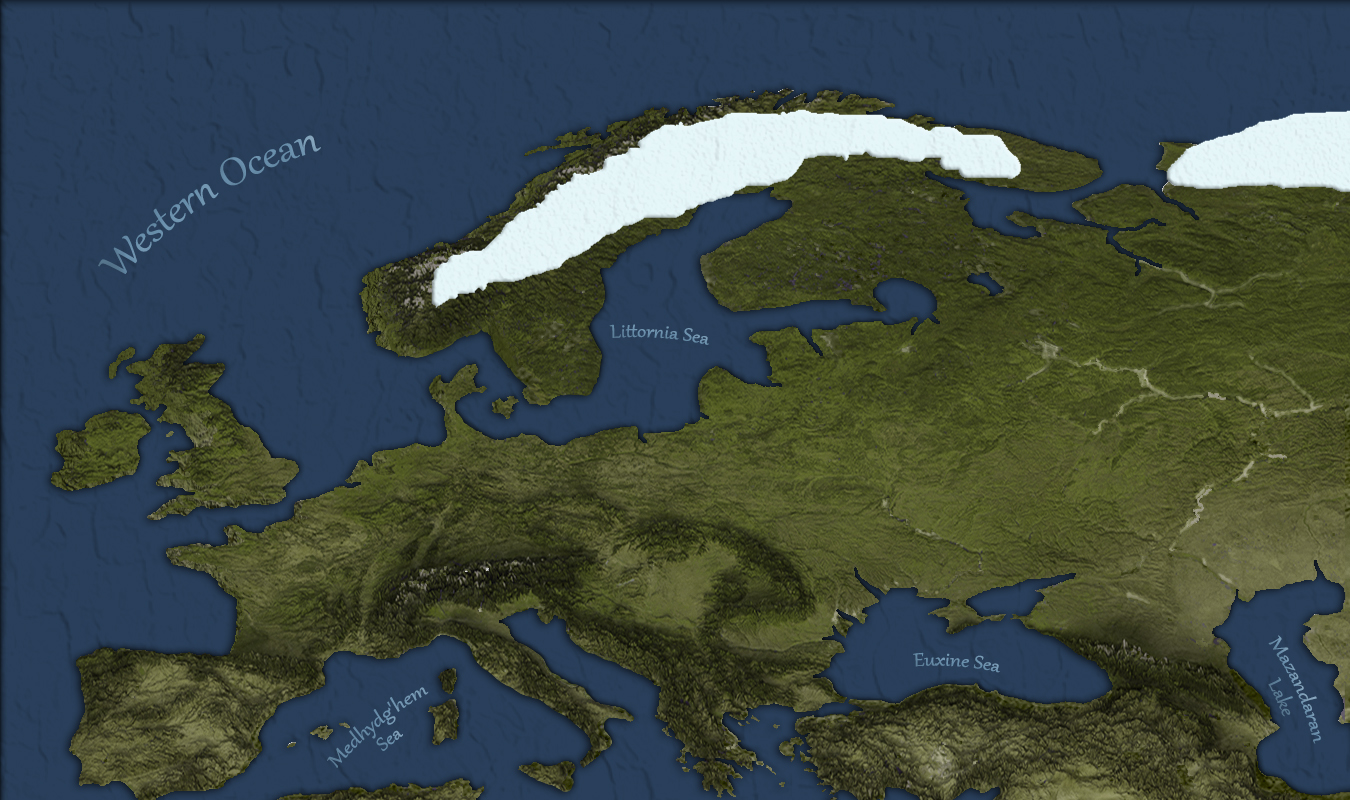
Another side effect of the rapid growth and melting of glaciers during this period was that a massive unstable mountain of silt had formed at the bottom of the ocean off the western coast of Skáney. A minor underwater earthquake caused it to collapse, and the resulting tsunami completely submerged Daganzi Island, shown in slide (F). Only a few centuries later the continued rise in ocean levels breached the land barrier to Ancylus Lake, and a massive flood of ocean water came roaring in to submerge the entire coastal plain and transforming Ancylus Lake into Littornia Sea, shown in slide (G).
The final flood of Polwes Pleudō was further south, where increasing sea levels caused land area losses in Cycladia. Eventually the land bridge separating the Medhydg'hem Sea from the large inland Euxine Lake was breached, causing a massive tidal wave and flooding of the surrounding area, shown in slide (H). This transformed Euxine Lake into the Euxine Sea, and marked the end of Polwes Pleudō in Europe.
The difference in average global temparature is dramatic enough that mainstream researchers in paleogeology and climatology generally don't even consider the Pluvial Turning to be in the same category as the Pagsian and Kara'apian Turnings. Using the terminology of geological research, for example, researchers refer to the Eemian interglacial period (which corresponds roughly with the Pagsian Turning) as the most recent period in earth's geological history that is comparable to our present day climatological period (the Meghalaian Turning). The Pluvial Turning is completely overlooked, falling within the larger interval of time that is simply identified as the most recent glacial period.
The "bump" of increased worldwide temperature during this time is discussed as a period of minor deglaciation or "interstadial" but is downplayed despite indicators from other fields of research of dramatic shifts in airidity and vegetation. The period is sometimes referred to as the Makhadma pluvial in Africa, with indicators that during this time northern Africa was going through a "green Sahara" period with increased humidity and lake cover. We can only assume that these factors are considered "minor" only because the temperature and ocean level records did not revert to the same levels they had in the previous Eemian interglacial. The impact of the warm, stable, and moist interval during this time was not at all minor, however, for the civilizations experiencing these climate shifts.
From a human perspective, the Pluvial Turning shows very clear typical "golden age" characteristics: the relative humidity made hunting and foraging easy, human populations exploded, and societies thrived. This turning saw the biggest expansion of humans out of Africa into Europe, as well as mass migrations southward of humans in Africa and Sunda. The Pluvial Turning ended with the spectacular and mysterious Laschamps Excursion, which caused multicolored auroroas to appear in the sky across the entire world, even at the equator, nearly every night. The daytime sun became deadly, with many neanders especially succumbing to burns on their skin if they stayed outside during the day, even when clouds covered the sky. The world had already been a somewhat mysterious and supernatural place for all of the sentient species of the world, but during this turning it became magical, forcing the people of the world to confront exactly how little they knew about how the universe works.
When Paukos Eisom began, Lake Jokull was a massive icewater lake separating Skáney from Variscides, shown in the first slide (A) above. Before the lake could rise high enough to break through the land barrier to the sea, however, the volcanic eruption at Laacher See in southern Variscides brought the Second Tādhēskō to a sudden halt in Europe. The explosion flattened all vegetation in a five kilometer radius, and threw a cloud of ash and sulfur into the atmosphere that was so dense it threw Europe into Paukos Eisom. Glaciers once more covered Skáney, as shown in the second slide (B).
Eventually the atmospheric ash cleared and the climate rebounded, so that Lake Jokull formed once again, shown in slide (C). The water rose more rapidly this time, and erosian patterns had altered the underlying land, so land barrier that had separated it from the ocean was breeched. The water drained into the ocean, leaving a much smaller body of water that was Yoldia Sea, shown in slide (D). Although ocean levels continued to rise, leading to Daganzi becoming an island, isostatic uplift also caused the land to shift and rise, so that Yoldia Sea became cut off from the ocean and it was transformed into the saltwater Ancylus Lake, shown in slide (E).
Another side effect of the rapid growth and melting of glaciers during this period was that a massive unstable mountain of silt had formed at the bottom of the ocean off the western coast of Skáney. A minor underwater earthquake caused it to collapse, and the resulting tsunami completely submerged Daganzi Island, shown in slide (F). Only a few centuries later the continued rise in ocean levels breached the land barrier to Ancylus Lake, and a massive flood of ocean water came roaring in to submerge the entire coastal plain and transforming Ancylus Lake into Littornia Sea, shown in slide (G).
The final flood of Polwes Pleudō was further south, where increasing sea levels caused land area losses in Cycladia. Eventually the land bridge separating the Medhydg'hem Sea from the large inland Euxine Lake was breached, causing a massive tidal wave and flooding of the surrounding area, shown in slide (H). This transformed Euxine Lake into the Euxine Sea, and marked the end of Polwes Pleudō in Europe.
The difference in average global temparature is dramatic enough that mainstream researchers in paleogeology and climatology generally don't even consider the Pluvial Turning to be in the same category as the Pagsian and Kara'apian Turnings. Using the terminology of geological research, for example, researchers refer to the Eemian interglacial period (which corresponds roughly with the Pagsian Turning) as the most recent period in earth's geological history that is comparable to our present day climatological period (the Meghalaian Turning). The Pluvial Turning is completely overlooked, falling within the larger interval of time that is simply identified as the most recent glacial period.
The "bump" of increased worldwide temperature during this time is discussed as a period of minor deglaciation or "interstadial" but is downplayed despite indicators from other fields of research of dramatic shifts in airidity and vegetation. The period is sometimes referred to as the Makhadma pluvial in Africa, with indicators that during this time northern Africa was going through a "green Sahara" period with increased humidity and lake cover. We can only assume that these factors are considered "minor" only because the temperature and ocean level records did not revert to the same levels they had in the previous Eemian interglacial. The impact of the warm, stable, and moist interval during this time was not at all minor, however, for the civilizations experiencing these climate shifts.
From a human perspective, the Pluvial Turning shows very clear typical "golden age" characteristics: the relative humidity made hunting and foraging easy, human populations exploded, and societies thrived. This turning saw the biggest expansion of humans out of Africa into Europe, as well as mass migrations southward of humans in Africa and Sunda. The Pluvial Turning ended with the spectacular and mysterious Laschamps Excursion, which caused multicolored auroroas to appear in the sky across the entire world, even at the equator, nearly every night. The daytime sun became deadly, with many neanders especially succumbing to burns on their skin if they stayed outside during the day, even when clouds covered the sky. The world had already been a somewhat mysterious and supernatural place for all of the sentient species of the world, but during this turning it became magical, forcing the people of the world to confront exactly how little they knew about how the universe works.
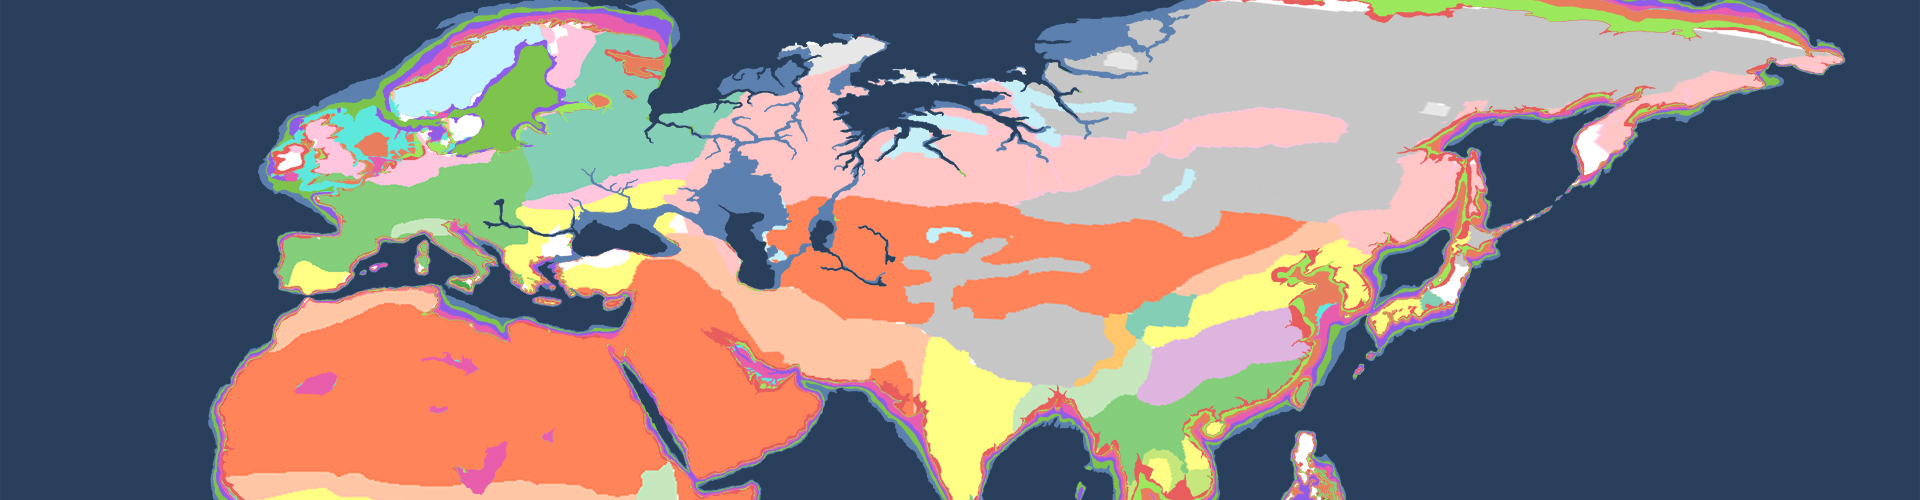
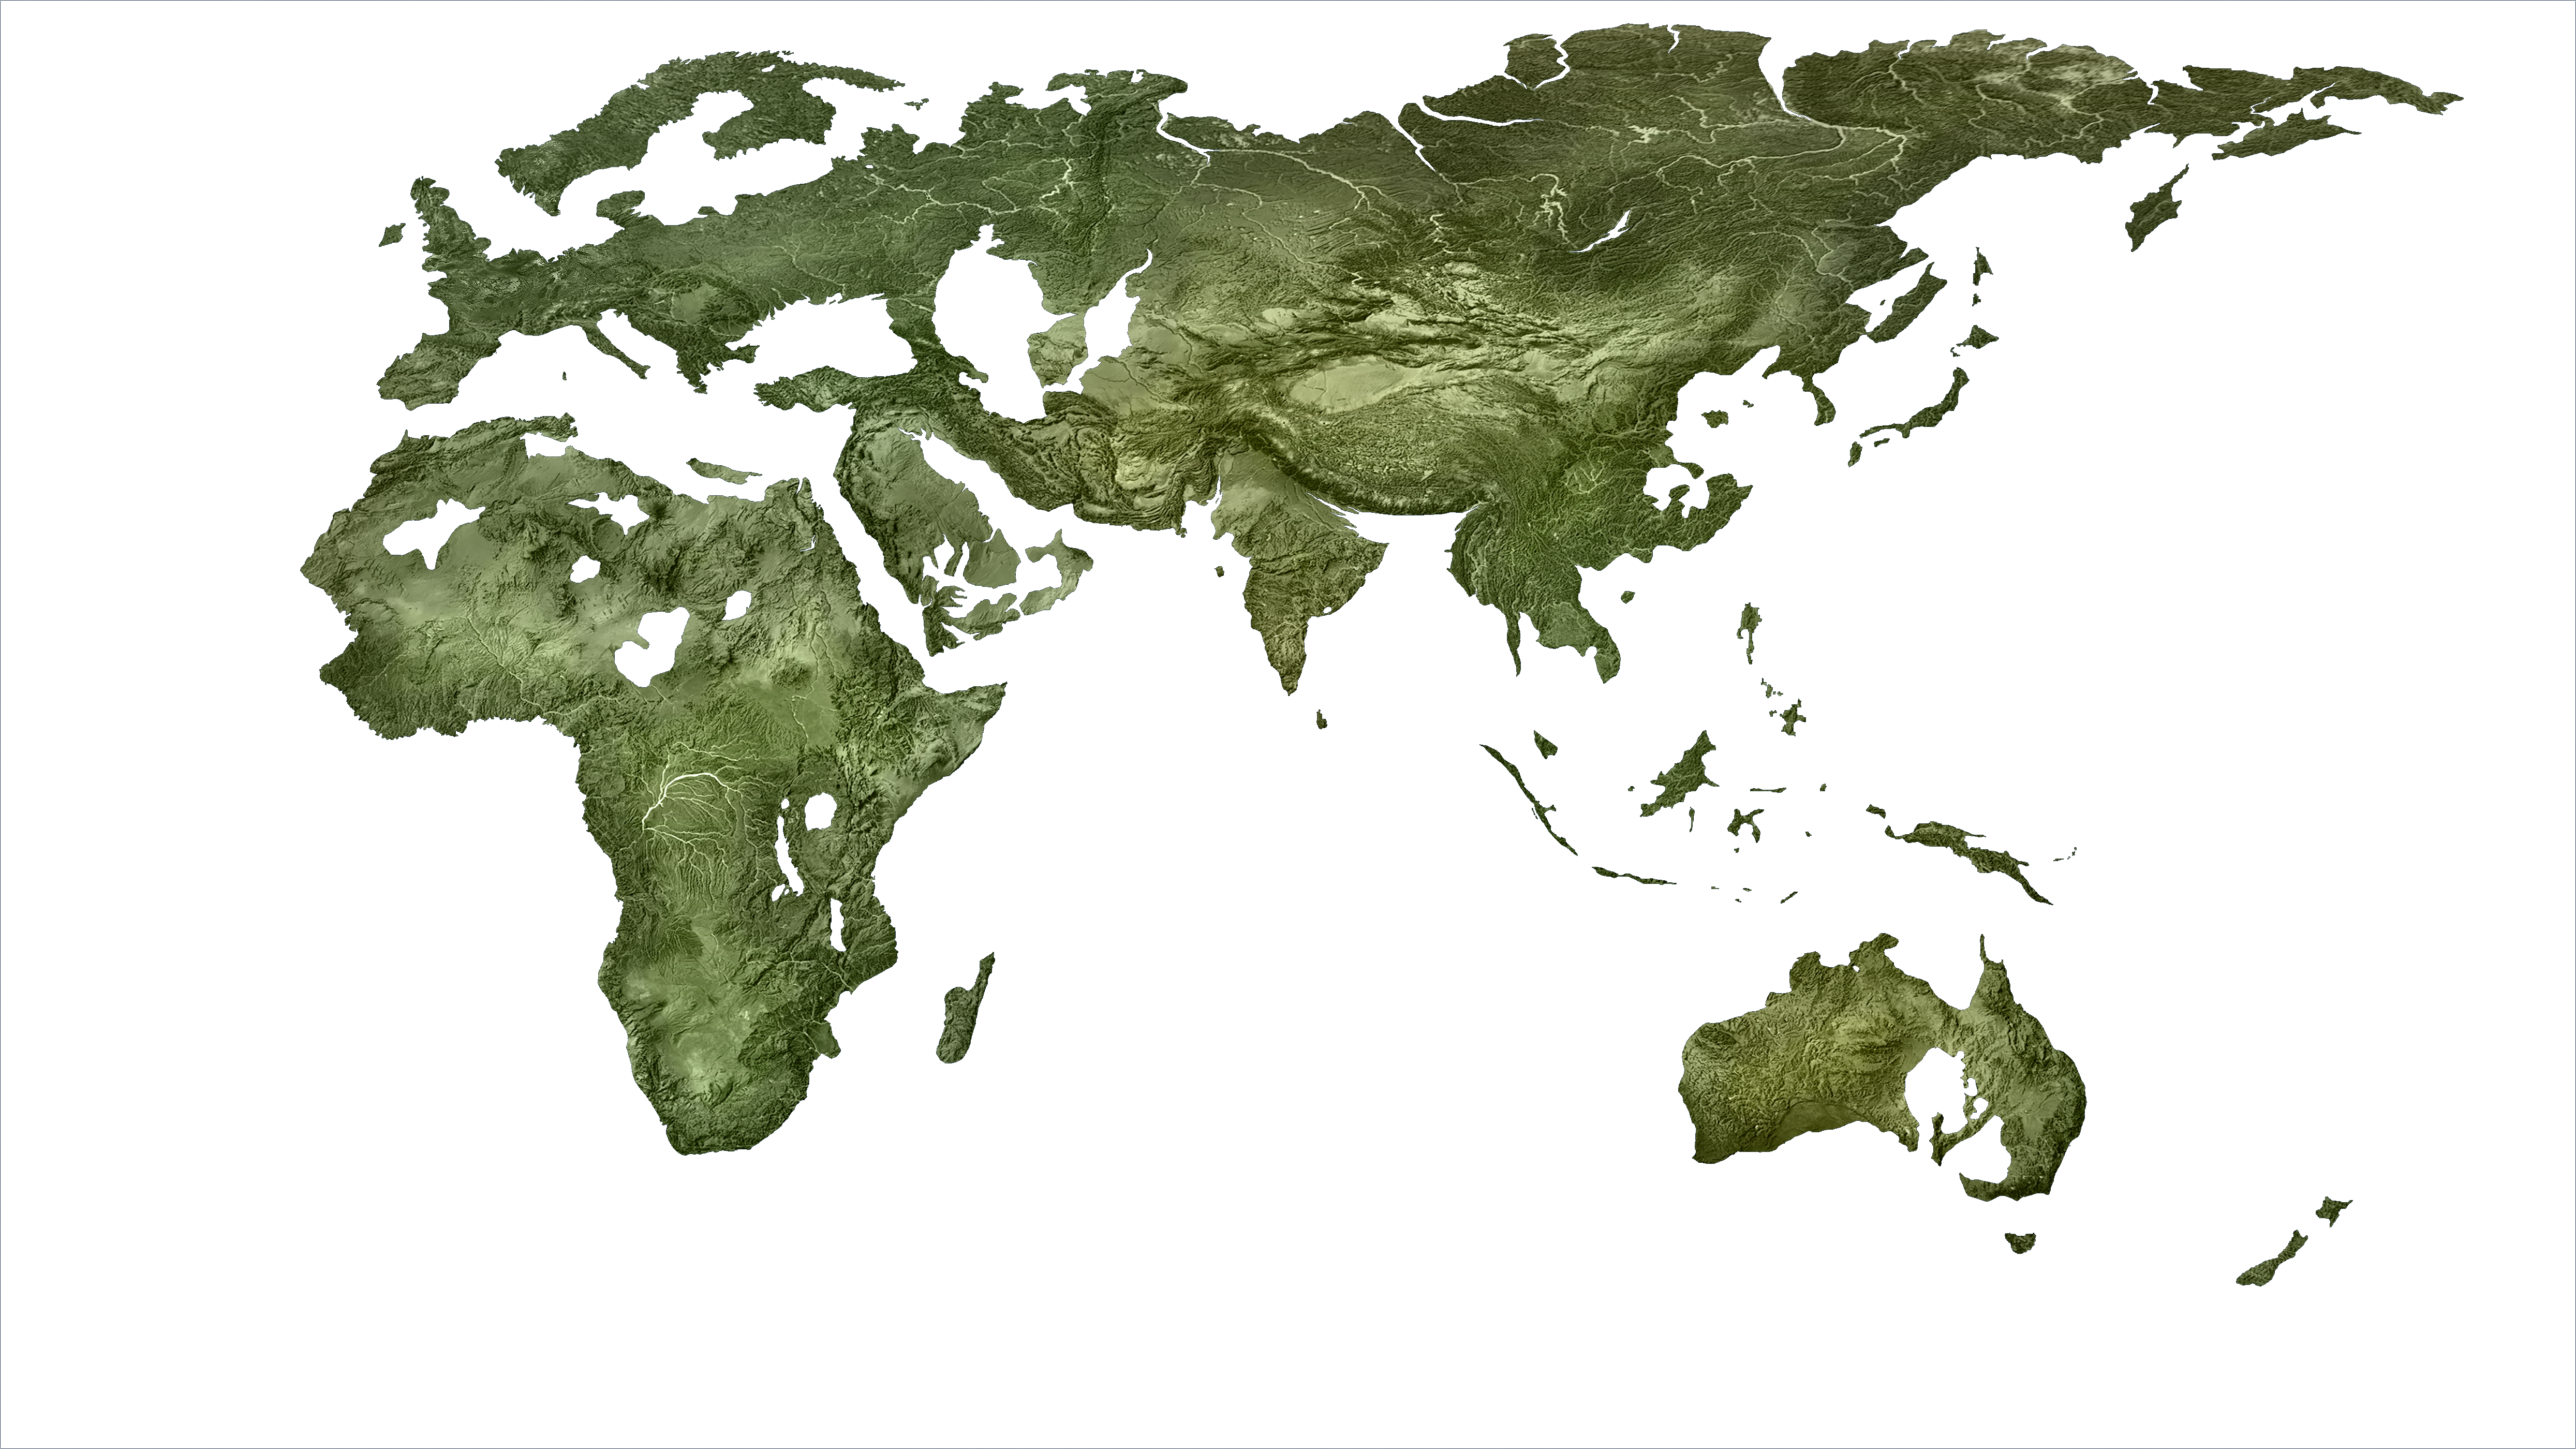
.") This visualization highlights another type of commonality among turnings of the same type. Despite the Pluvial Turning having a lower global average temperature than the other two golden ages, you can see it produced the same green-and-wet tropical belt, with multiple lakes in northern Africa and waterways separating landmasses that had been connected when sea levels were lower. This is one of many cyclical phenomena that substantiate the fourfold typology of turnings that was introduced by Edward Kelley and is still used in the scholarship of turnings today.
This visualization highlights another type of commonality among turnings of the same type. Despite the Pluvial Turning having a lower global average temperature than the other two golden ages, you can see it produced the same green-and-wet tropical belt, with multiple lakes in northern Africa and waterways separating landmasses that had been connected when sea levels were lower. This is one of many cyclical phenomena that substantiate the fourfold typology of turnings that was introduced by Edward Kelley and is still used in the scholarship of turnings today.
Part 1: Coastlines
Timeslice Maps
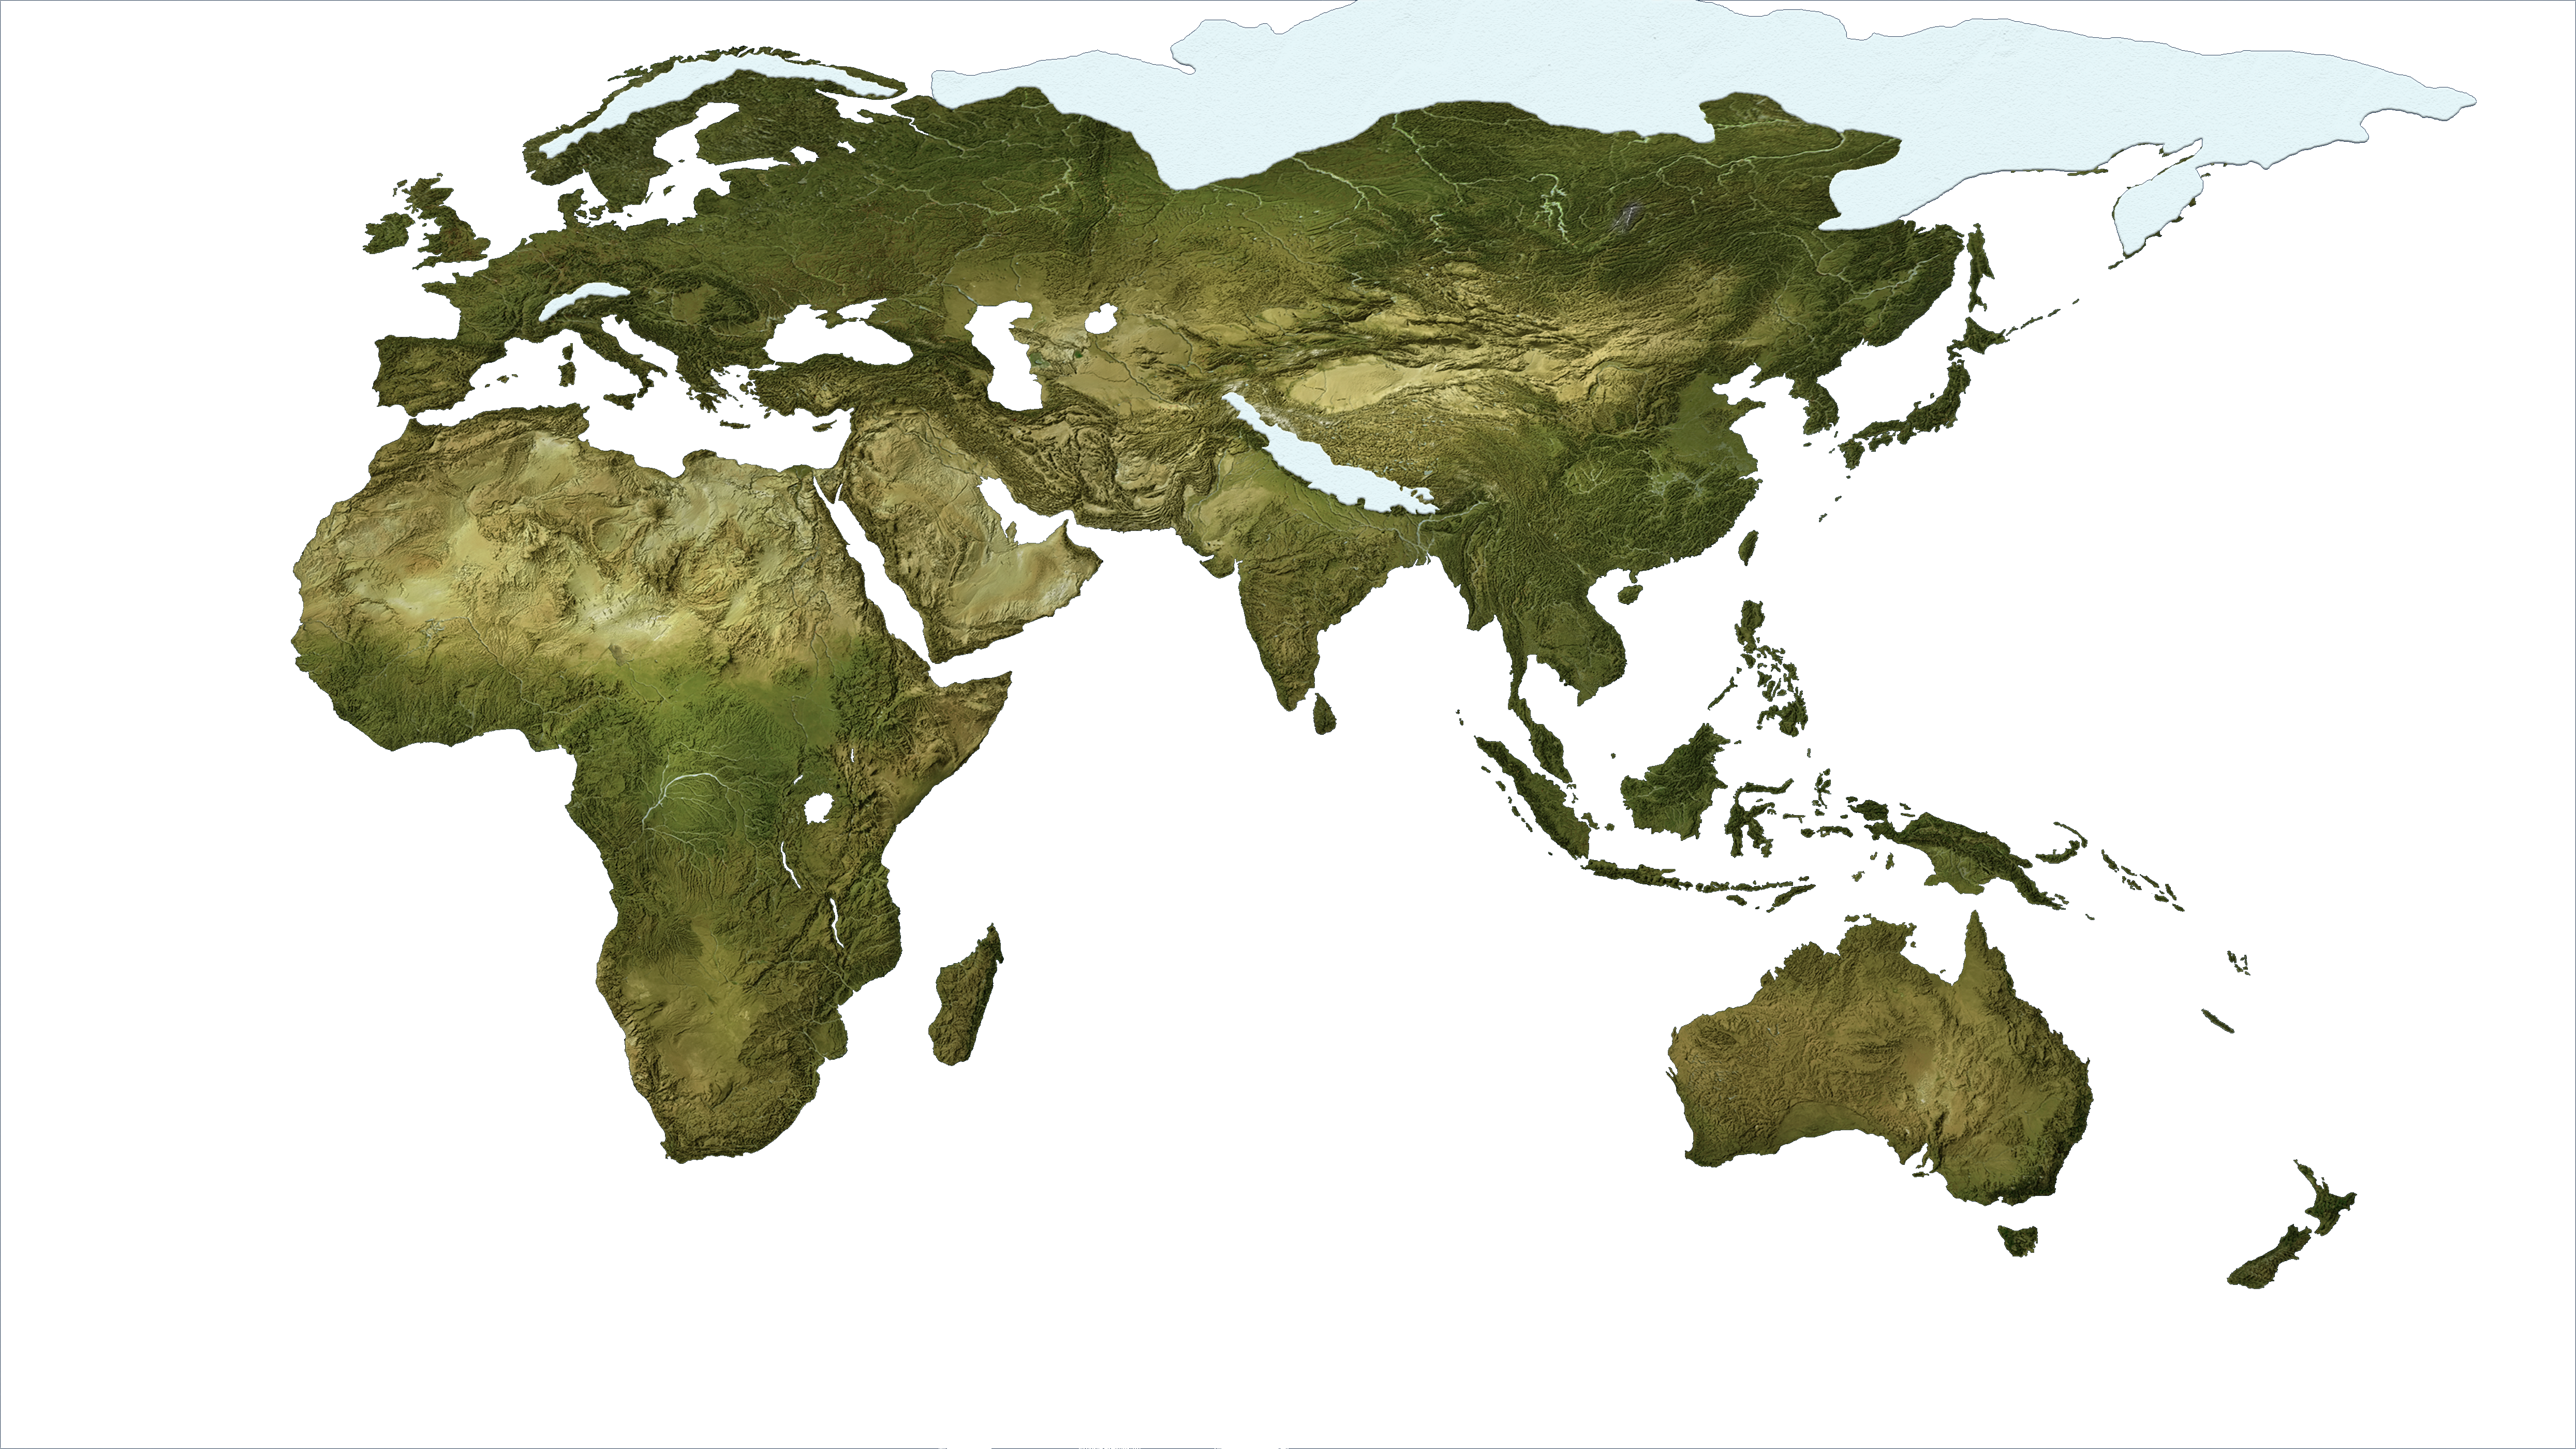
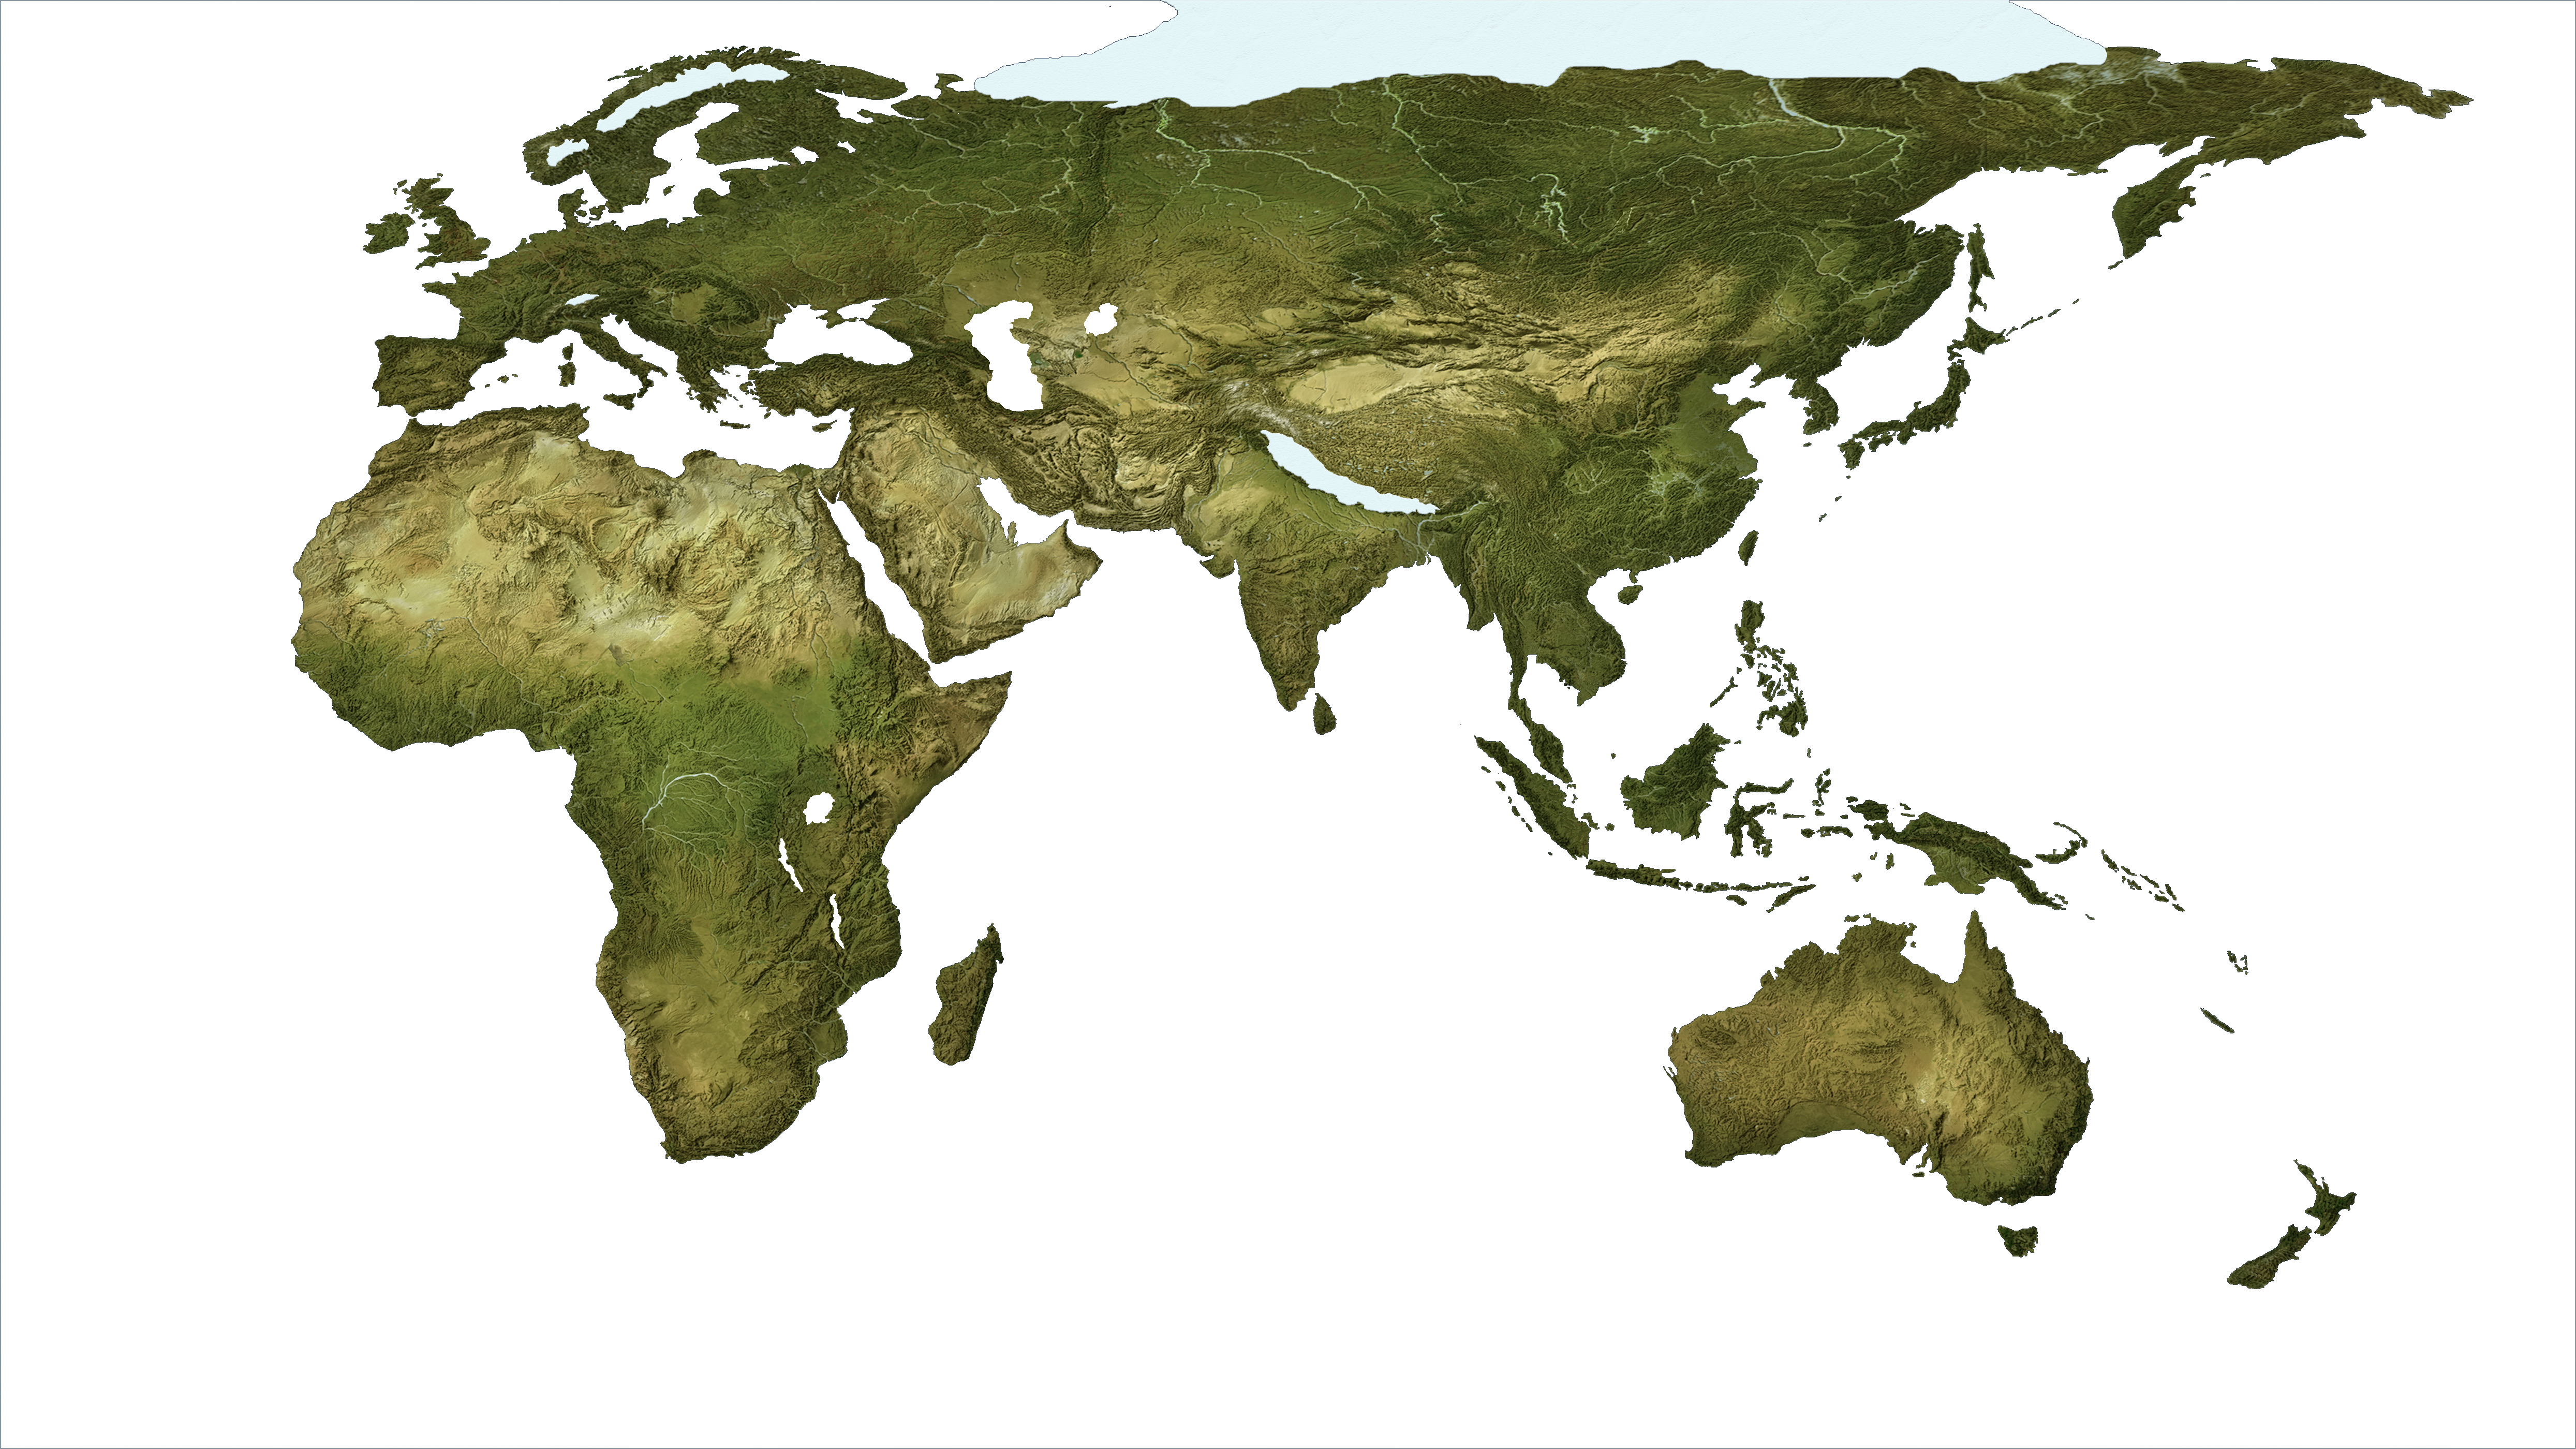
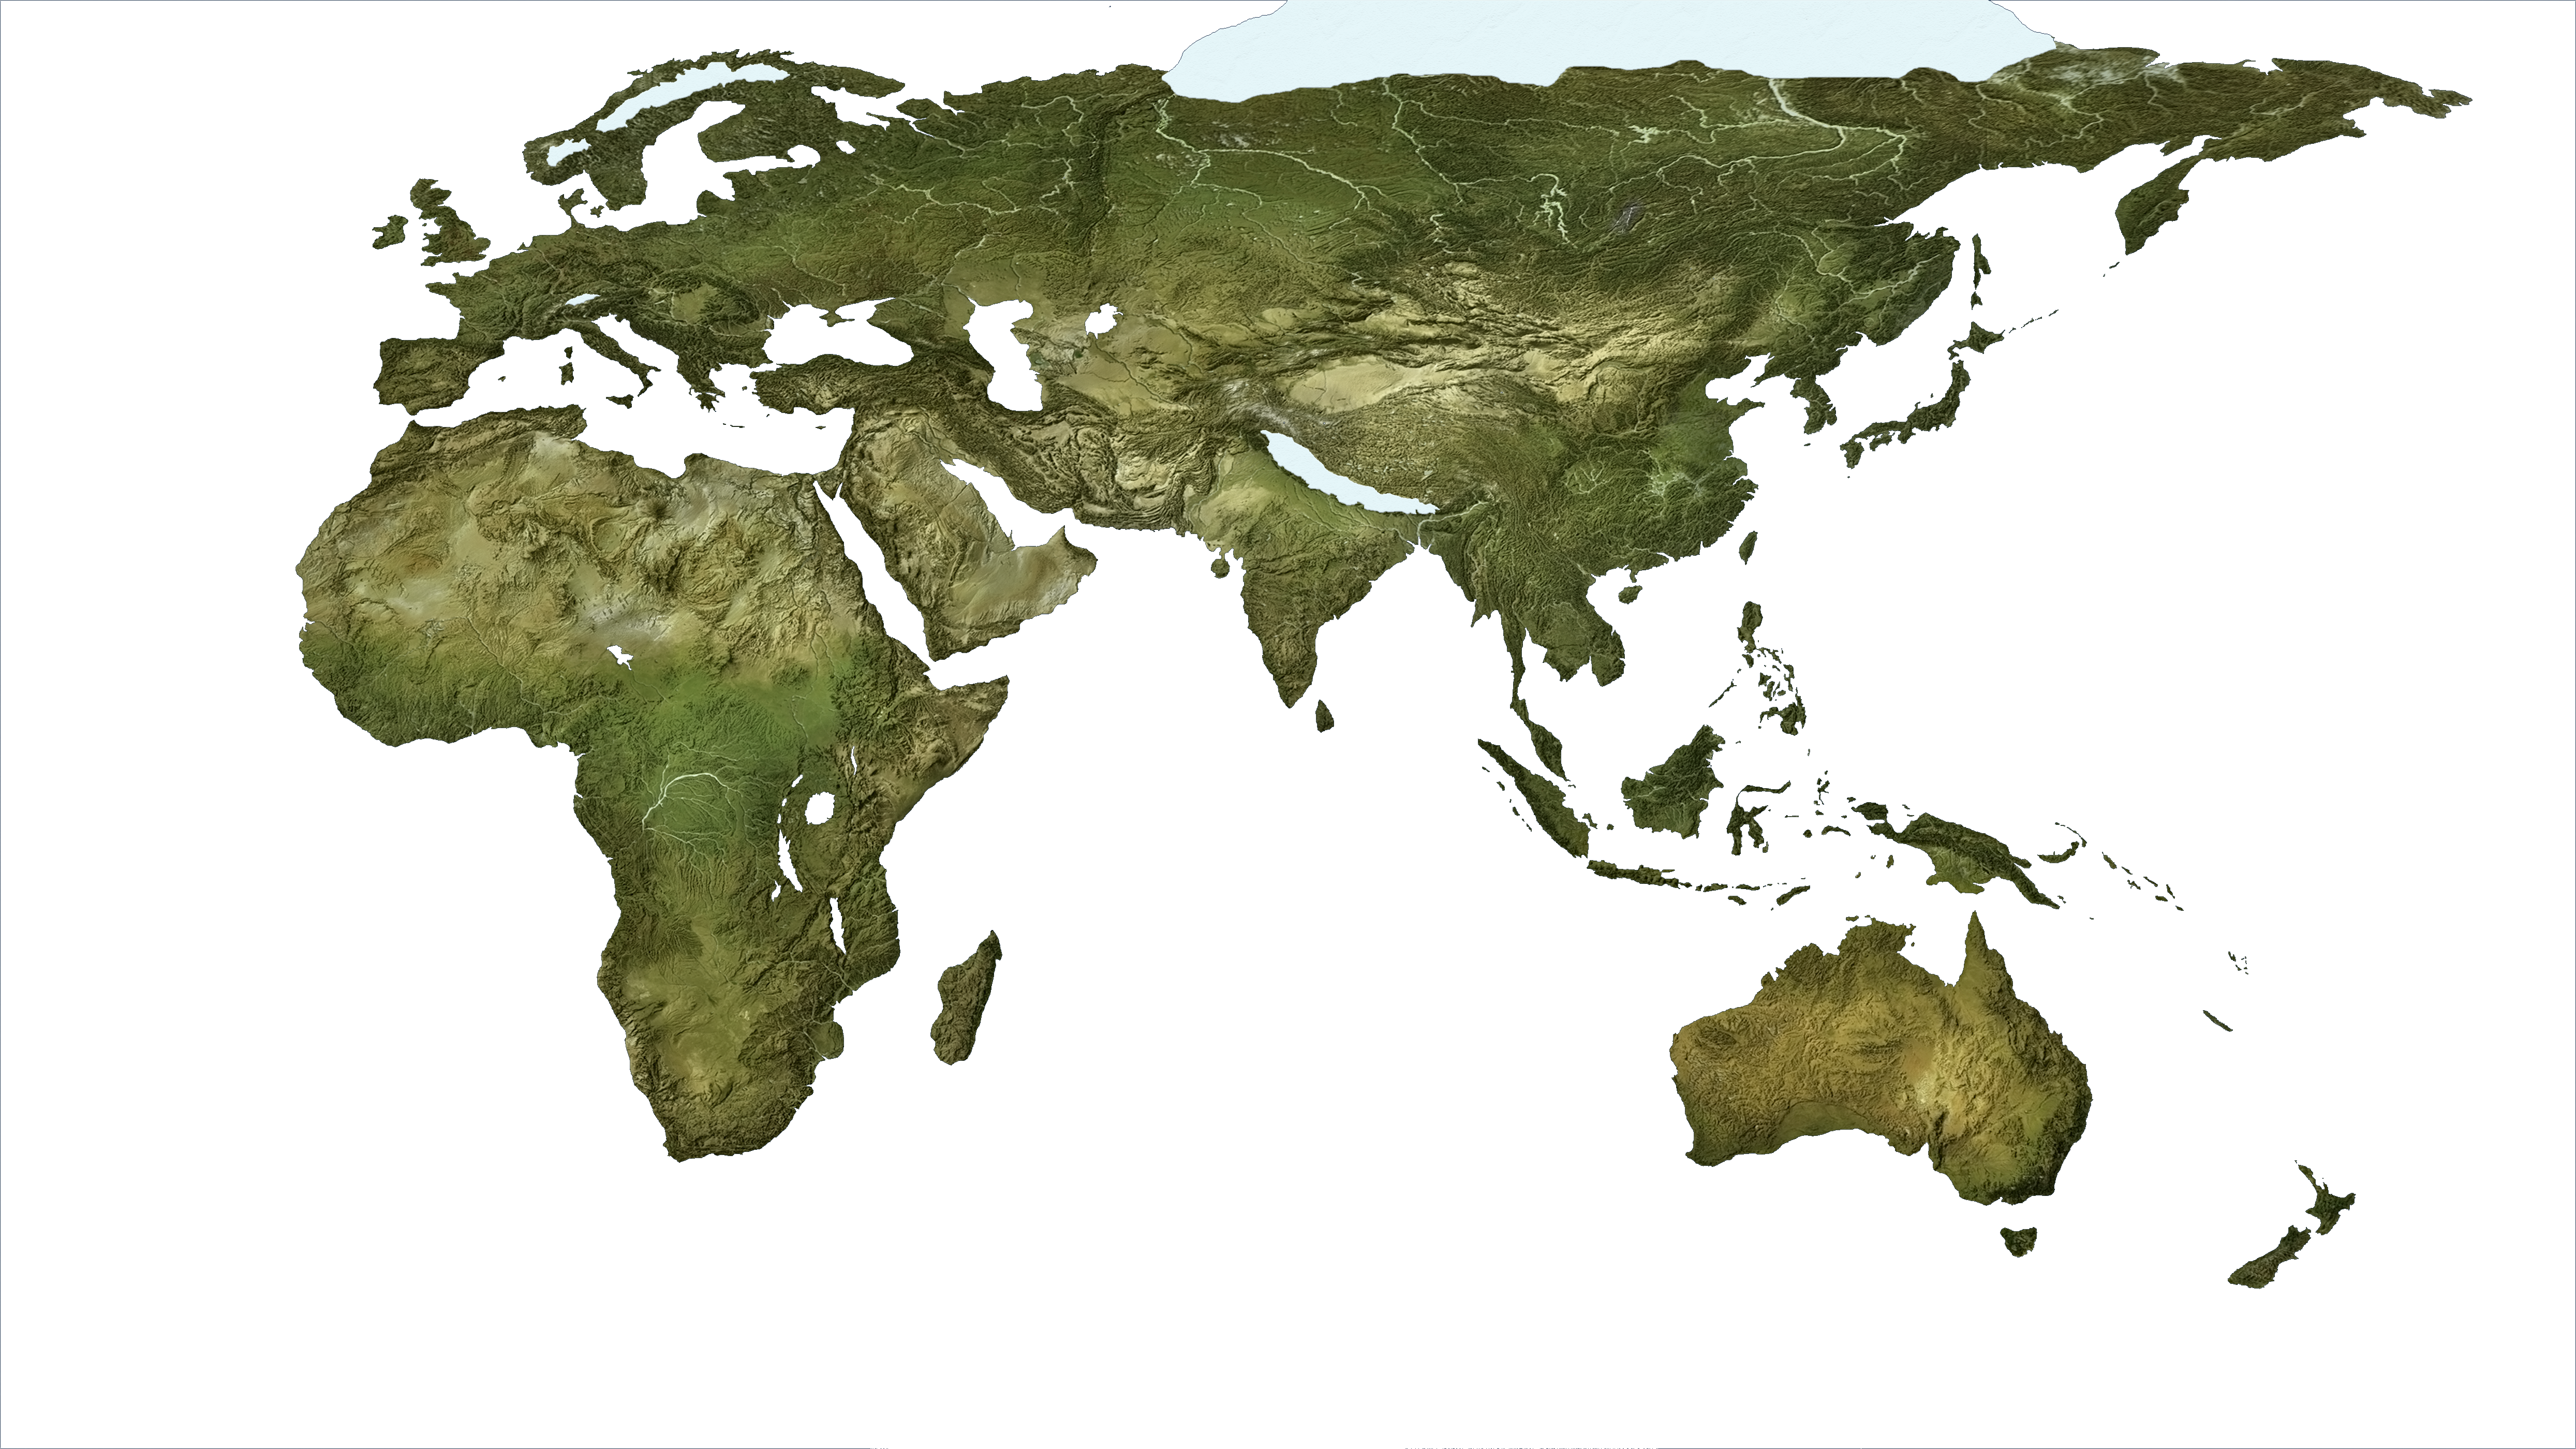
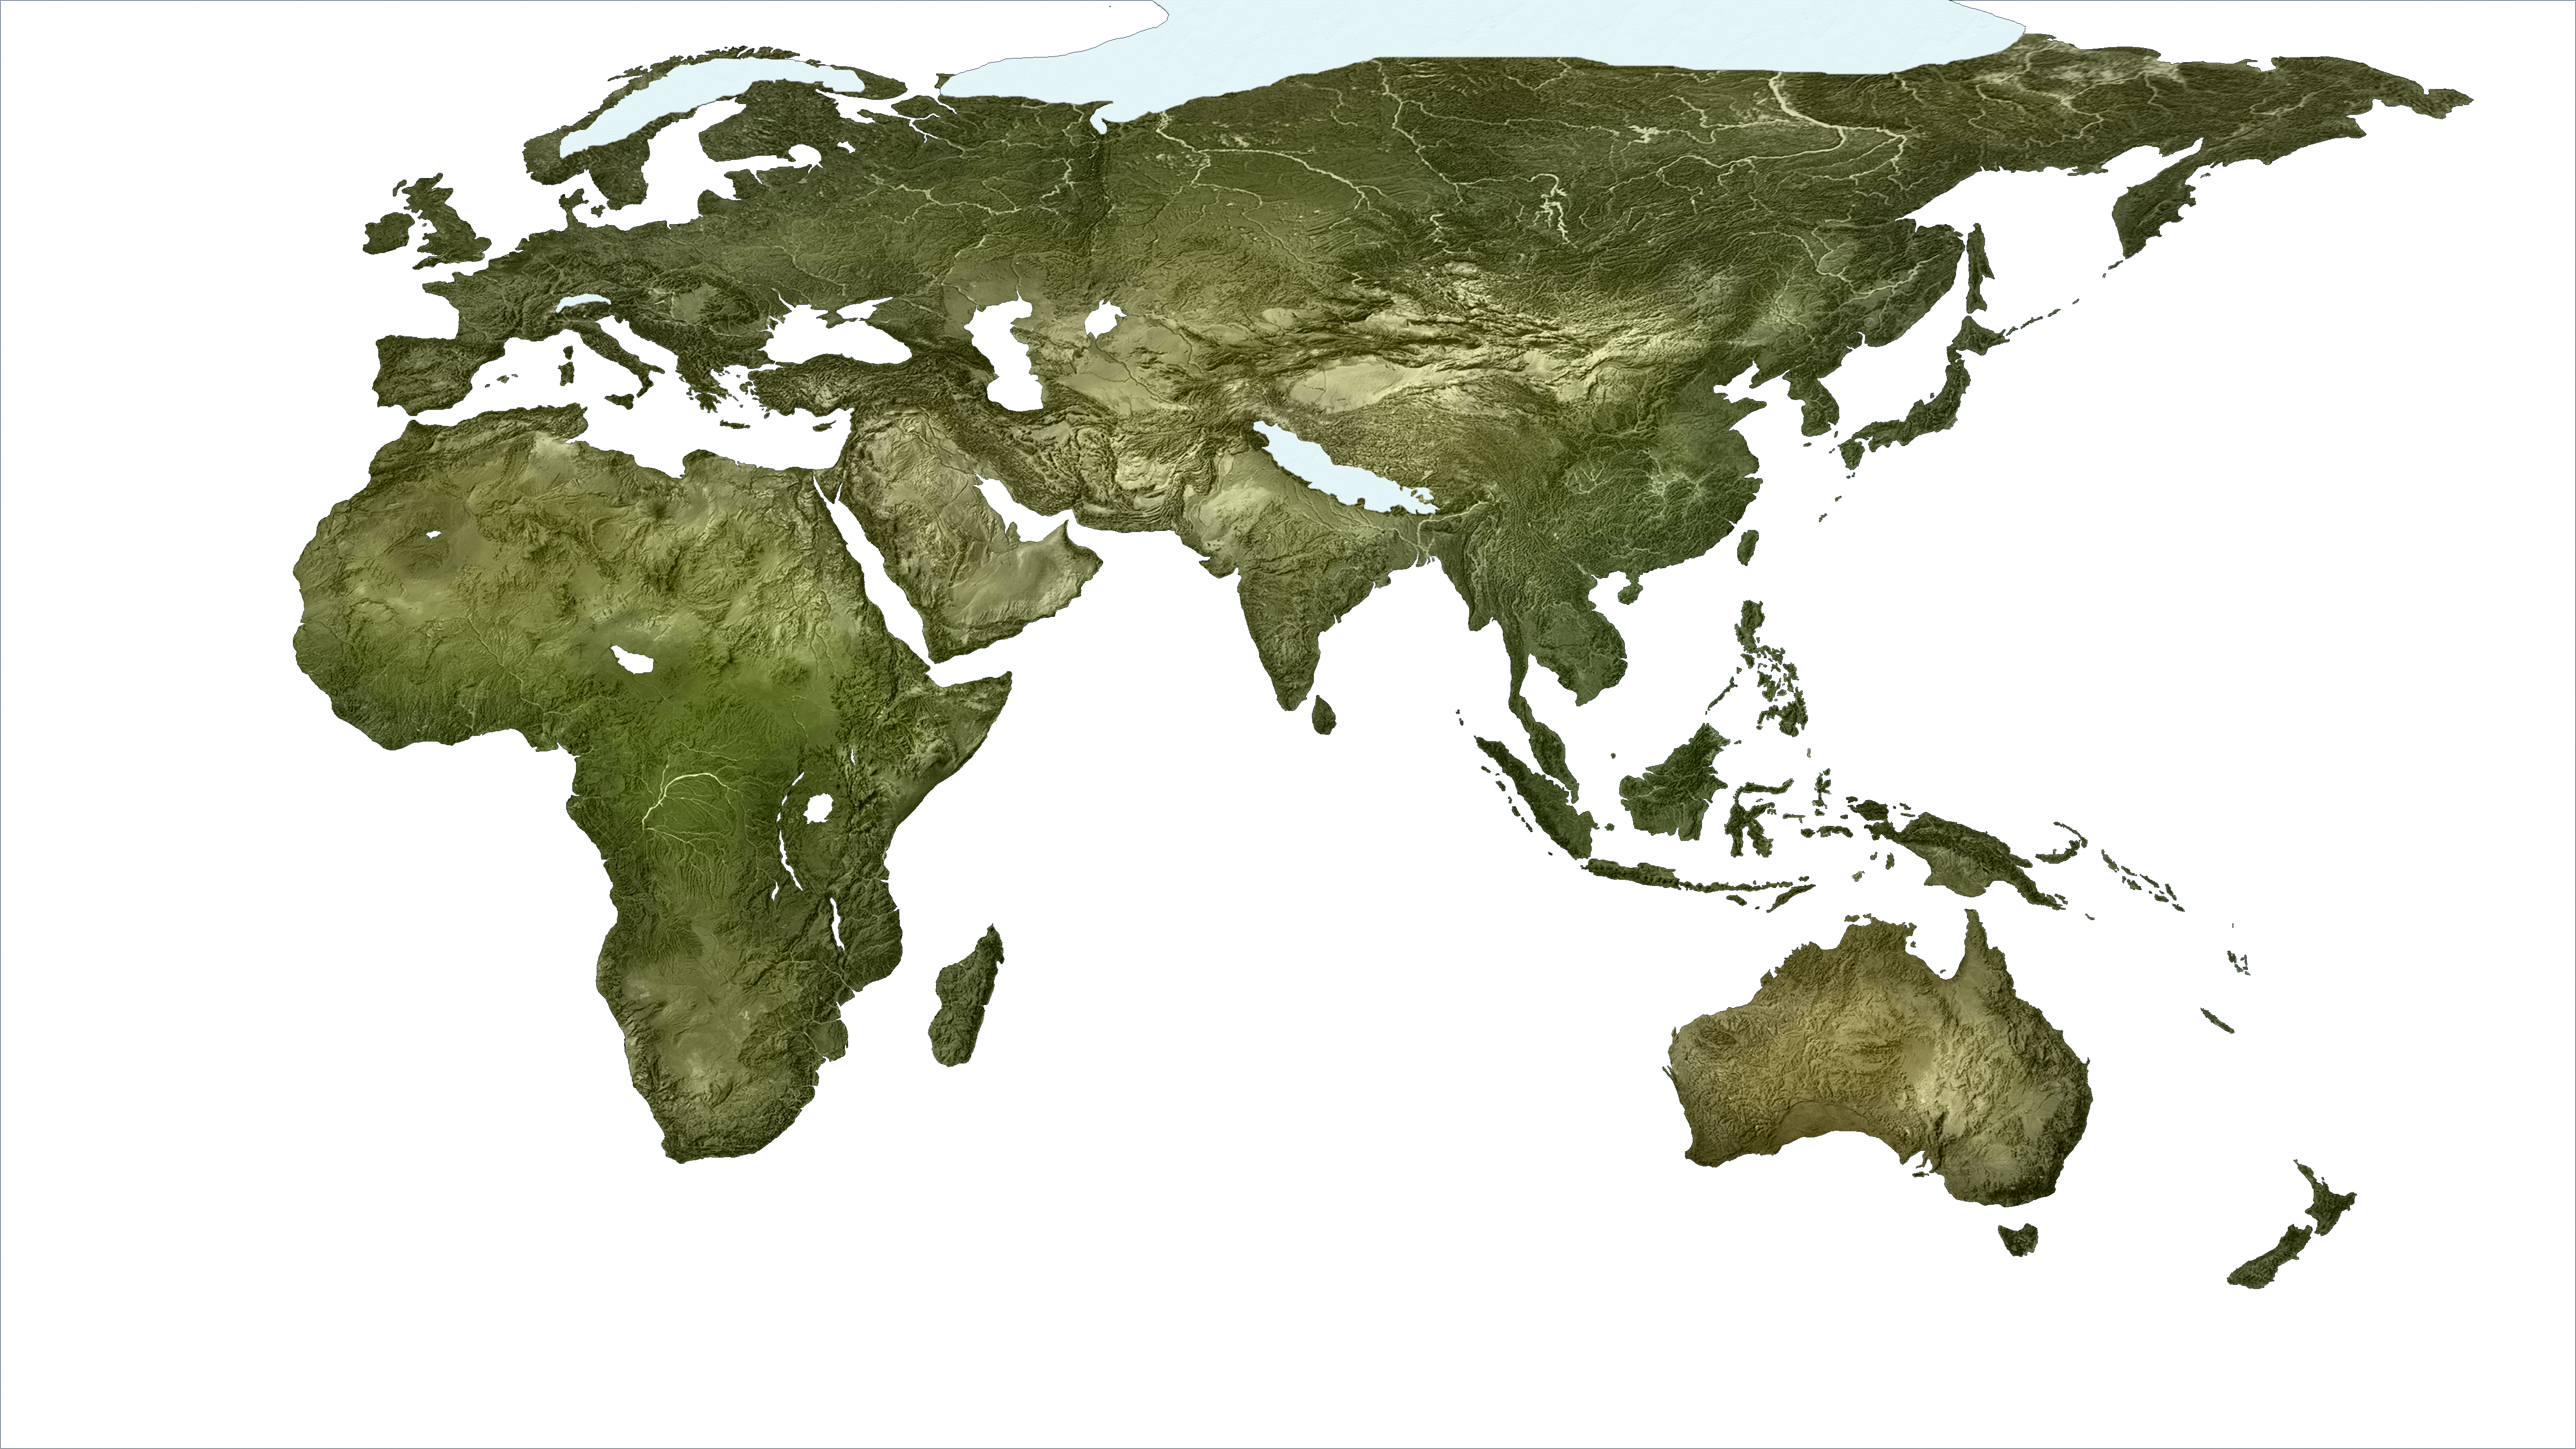
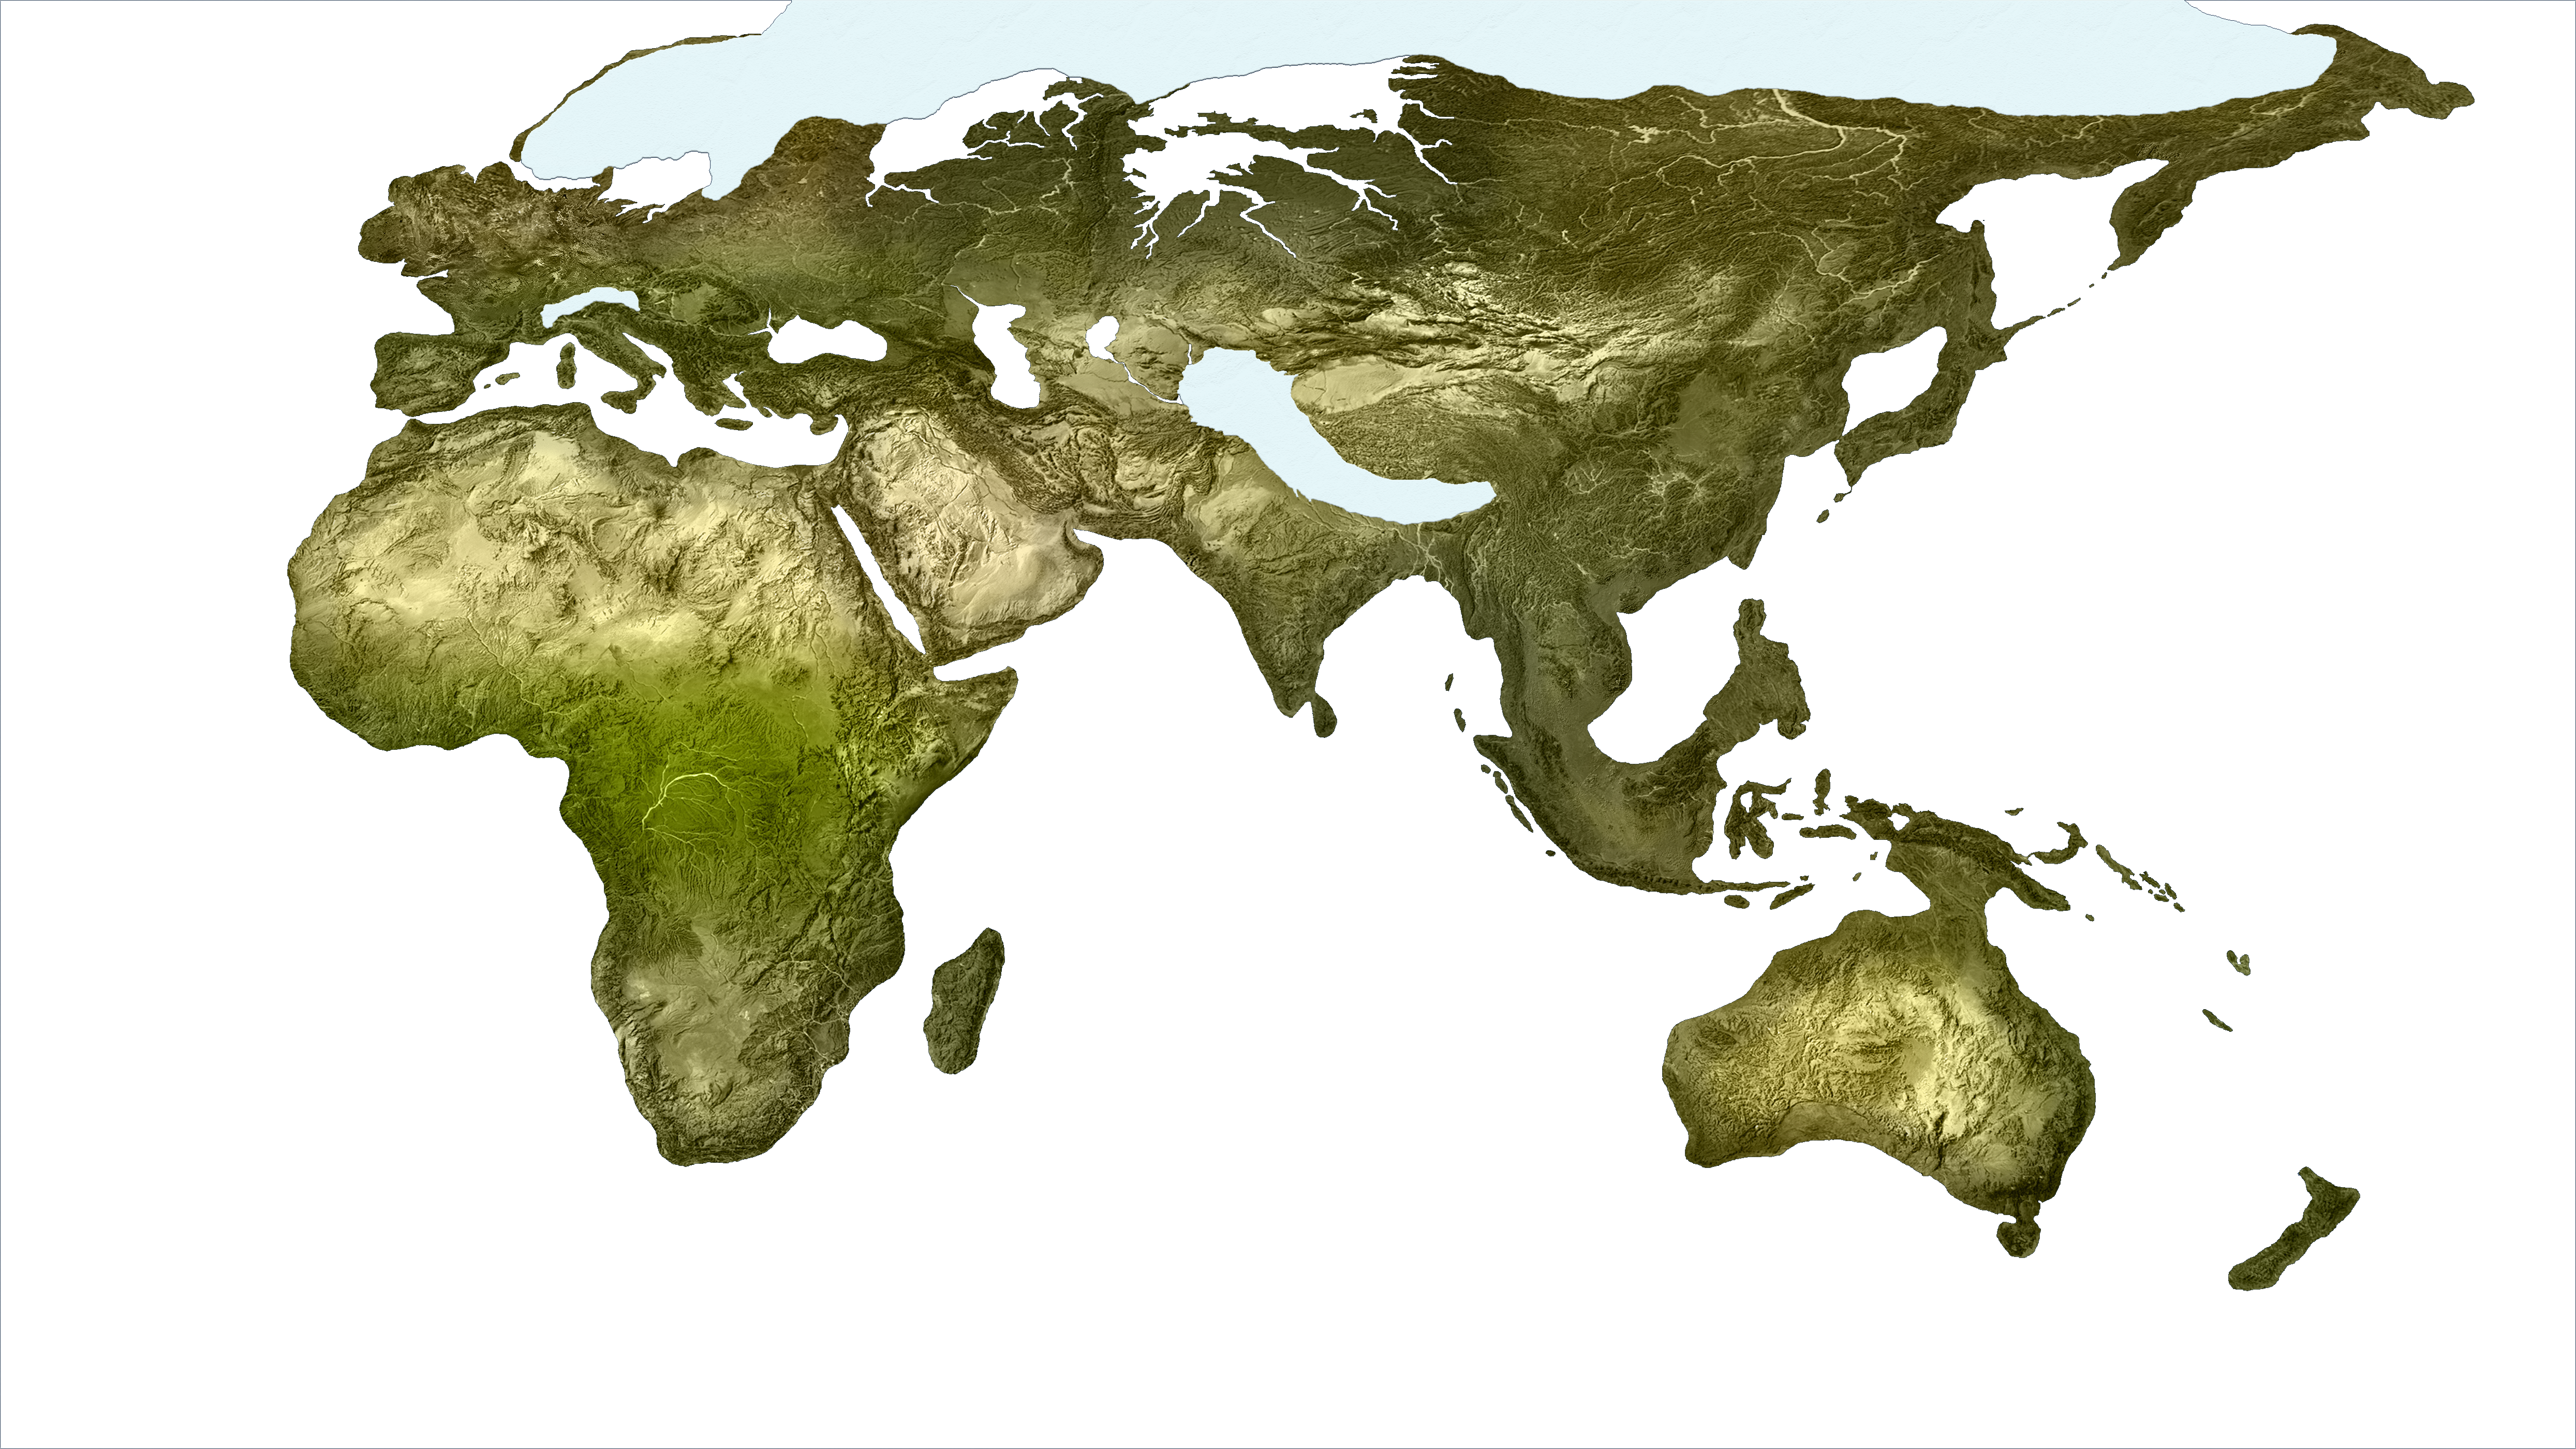
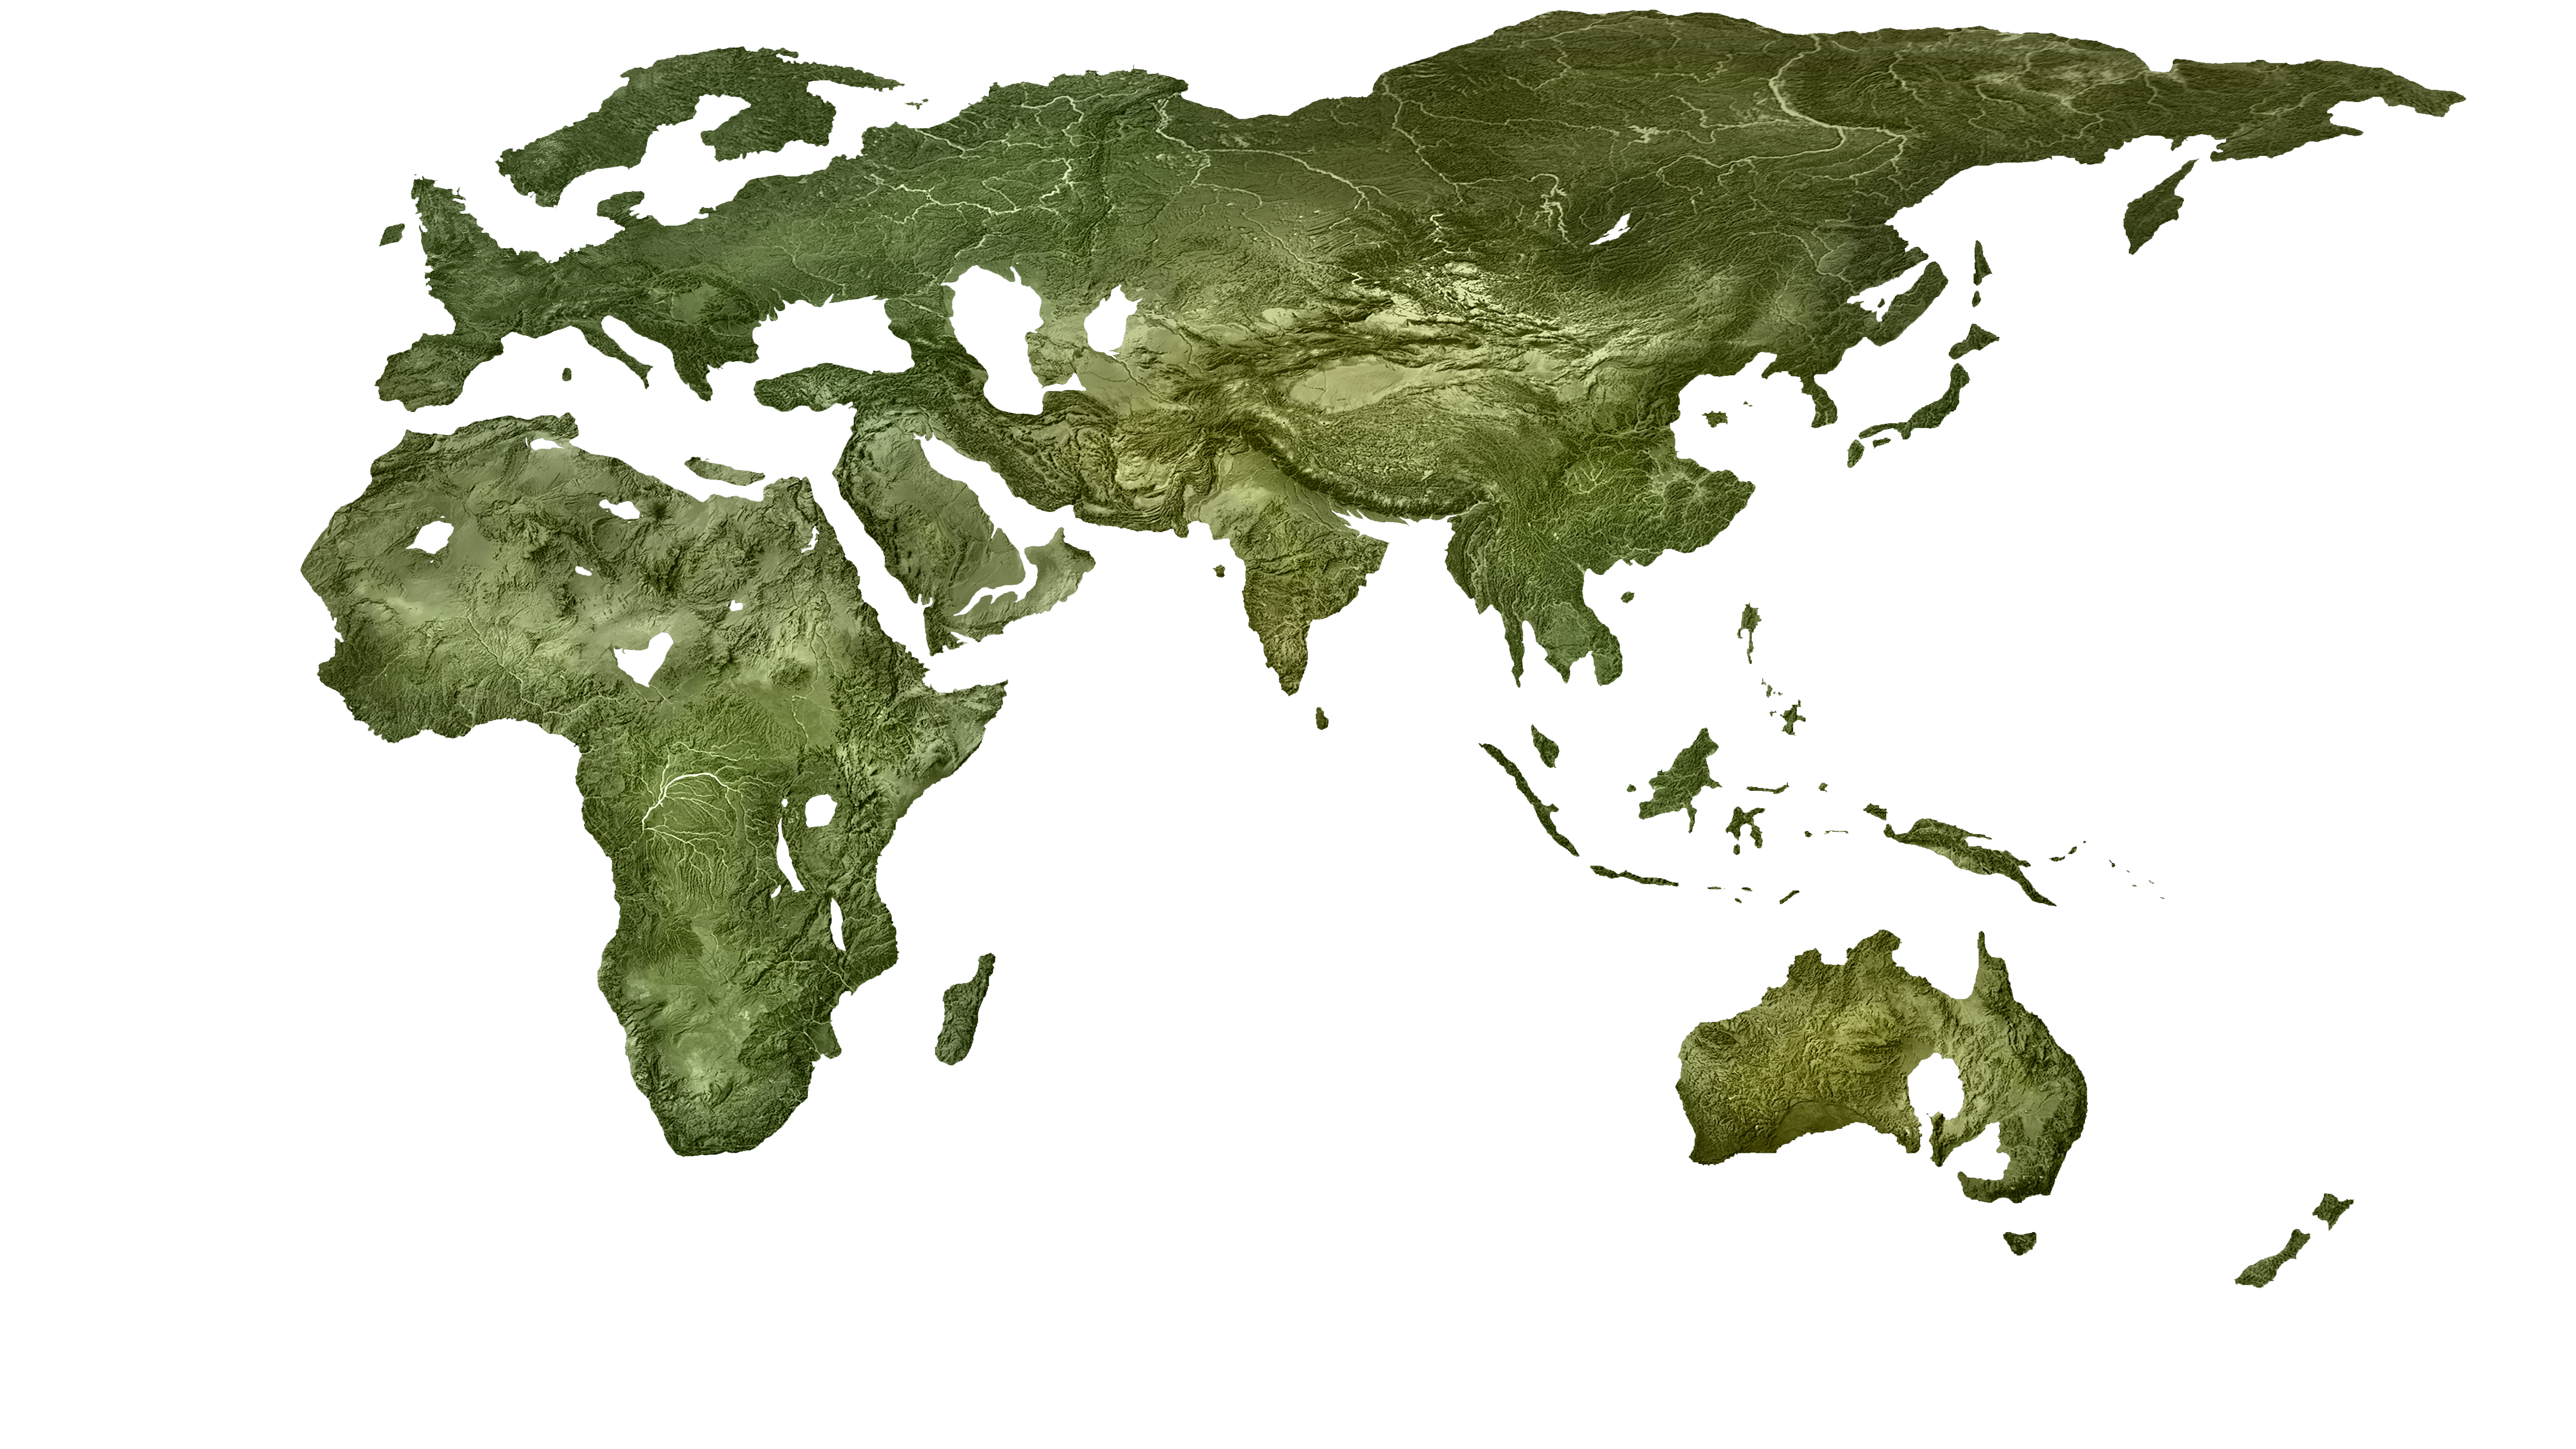
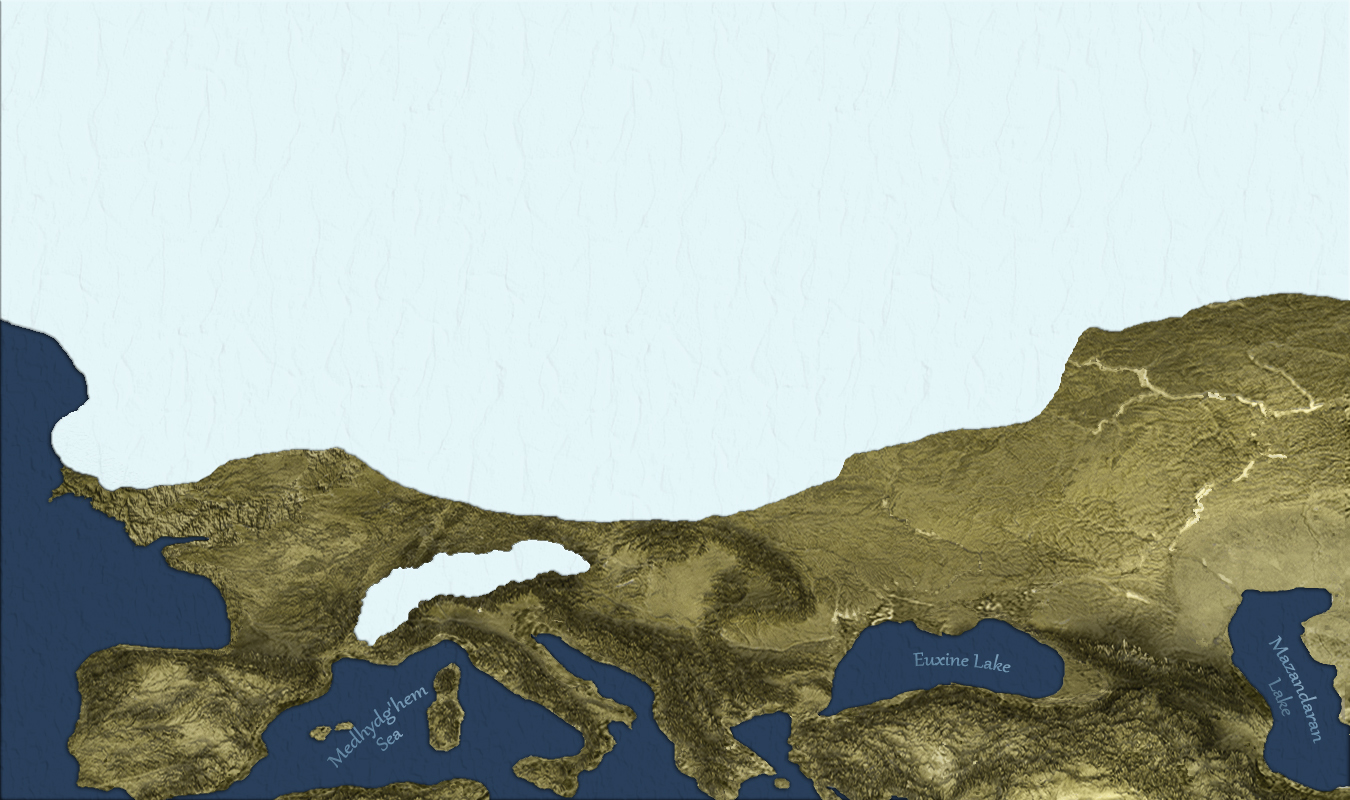
Scrolling through a series of world maps showing slices of time can create a self-guided animation effect, allowing you to watch as glaciers grow and dwindle, as sea levels rise and fall, and as deserts are slowly formed and then disappear again with changes in atmospheric humidity. Permafrost and permanent ice cover are shown in white. Moisture and airidity are shown using colors that range from green to pale yellow on land areas.
1,950 BP: late Meghalaian Turning
3,125 BP: early Meghalaian Turning
4,213 BP: Kara'apian ends, Meghalaian begins
7,410 BP: end of Polwes Pleudō
13,077 BP: start of Paukos Eisom
15,130 BP: floods of the Second Tādhēskō
17,250 BP: early Second Tādhēskō
20,080 BP: Srīgosian ends, Second Tādhēskō begins
23,000 BP: late Srīgosian Turning
27,000 BP: early Srīgosian Turning
30,750 BP: Sṇterían ends, Srīgosian begins
40,150 BP: Pluvial ends, Sṇterían begins
54,100 BP: First Tādhēskō ends, Pluvial begins
64,560 BP: the transition from the Ougrosian Turning to the First Tādhēskō.
73,110 BP: Recosian ends, Ougrosian begins
85,000 BP: late Recosian Turning
97,000 BP: after glaciers cover Skáney during the Recosian Turning
113,700 BP: the transition from the Pagsian Turning to the Recosian Turning
125,000 BP: the peak of the Pagsian Turning
Time Series Graphs
A more direct way to visualize changes in key variables such as global temperature and global sea level is to graph them as a function of time. In each graph below, color-coded regions represent the four turning types: golden age (yellow), decline (orange), ice age (blue), recovery (green). The European Paukos Eisom and Polwes Pleudō are not showning in the color-coding.
Global temperature over time
Global sea level over time
Coastline Sequences
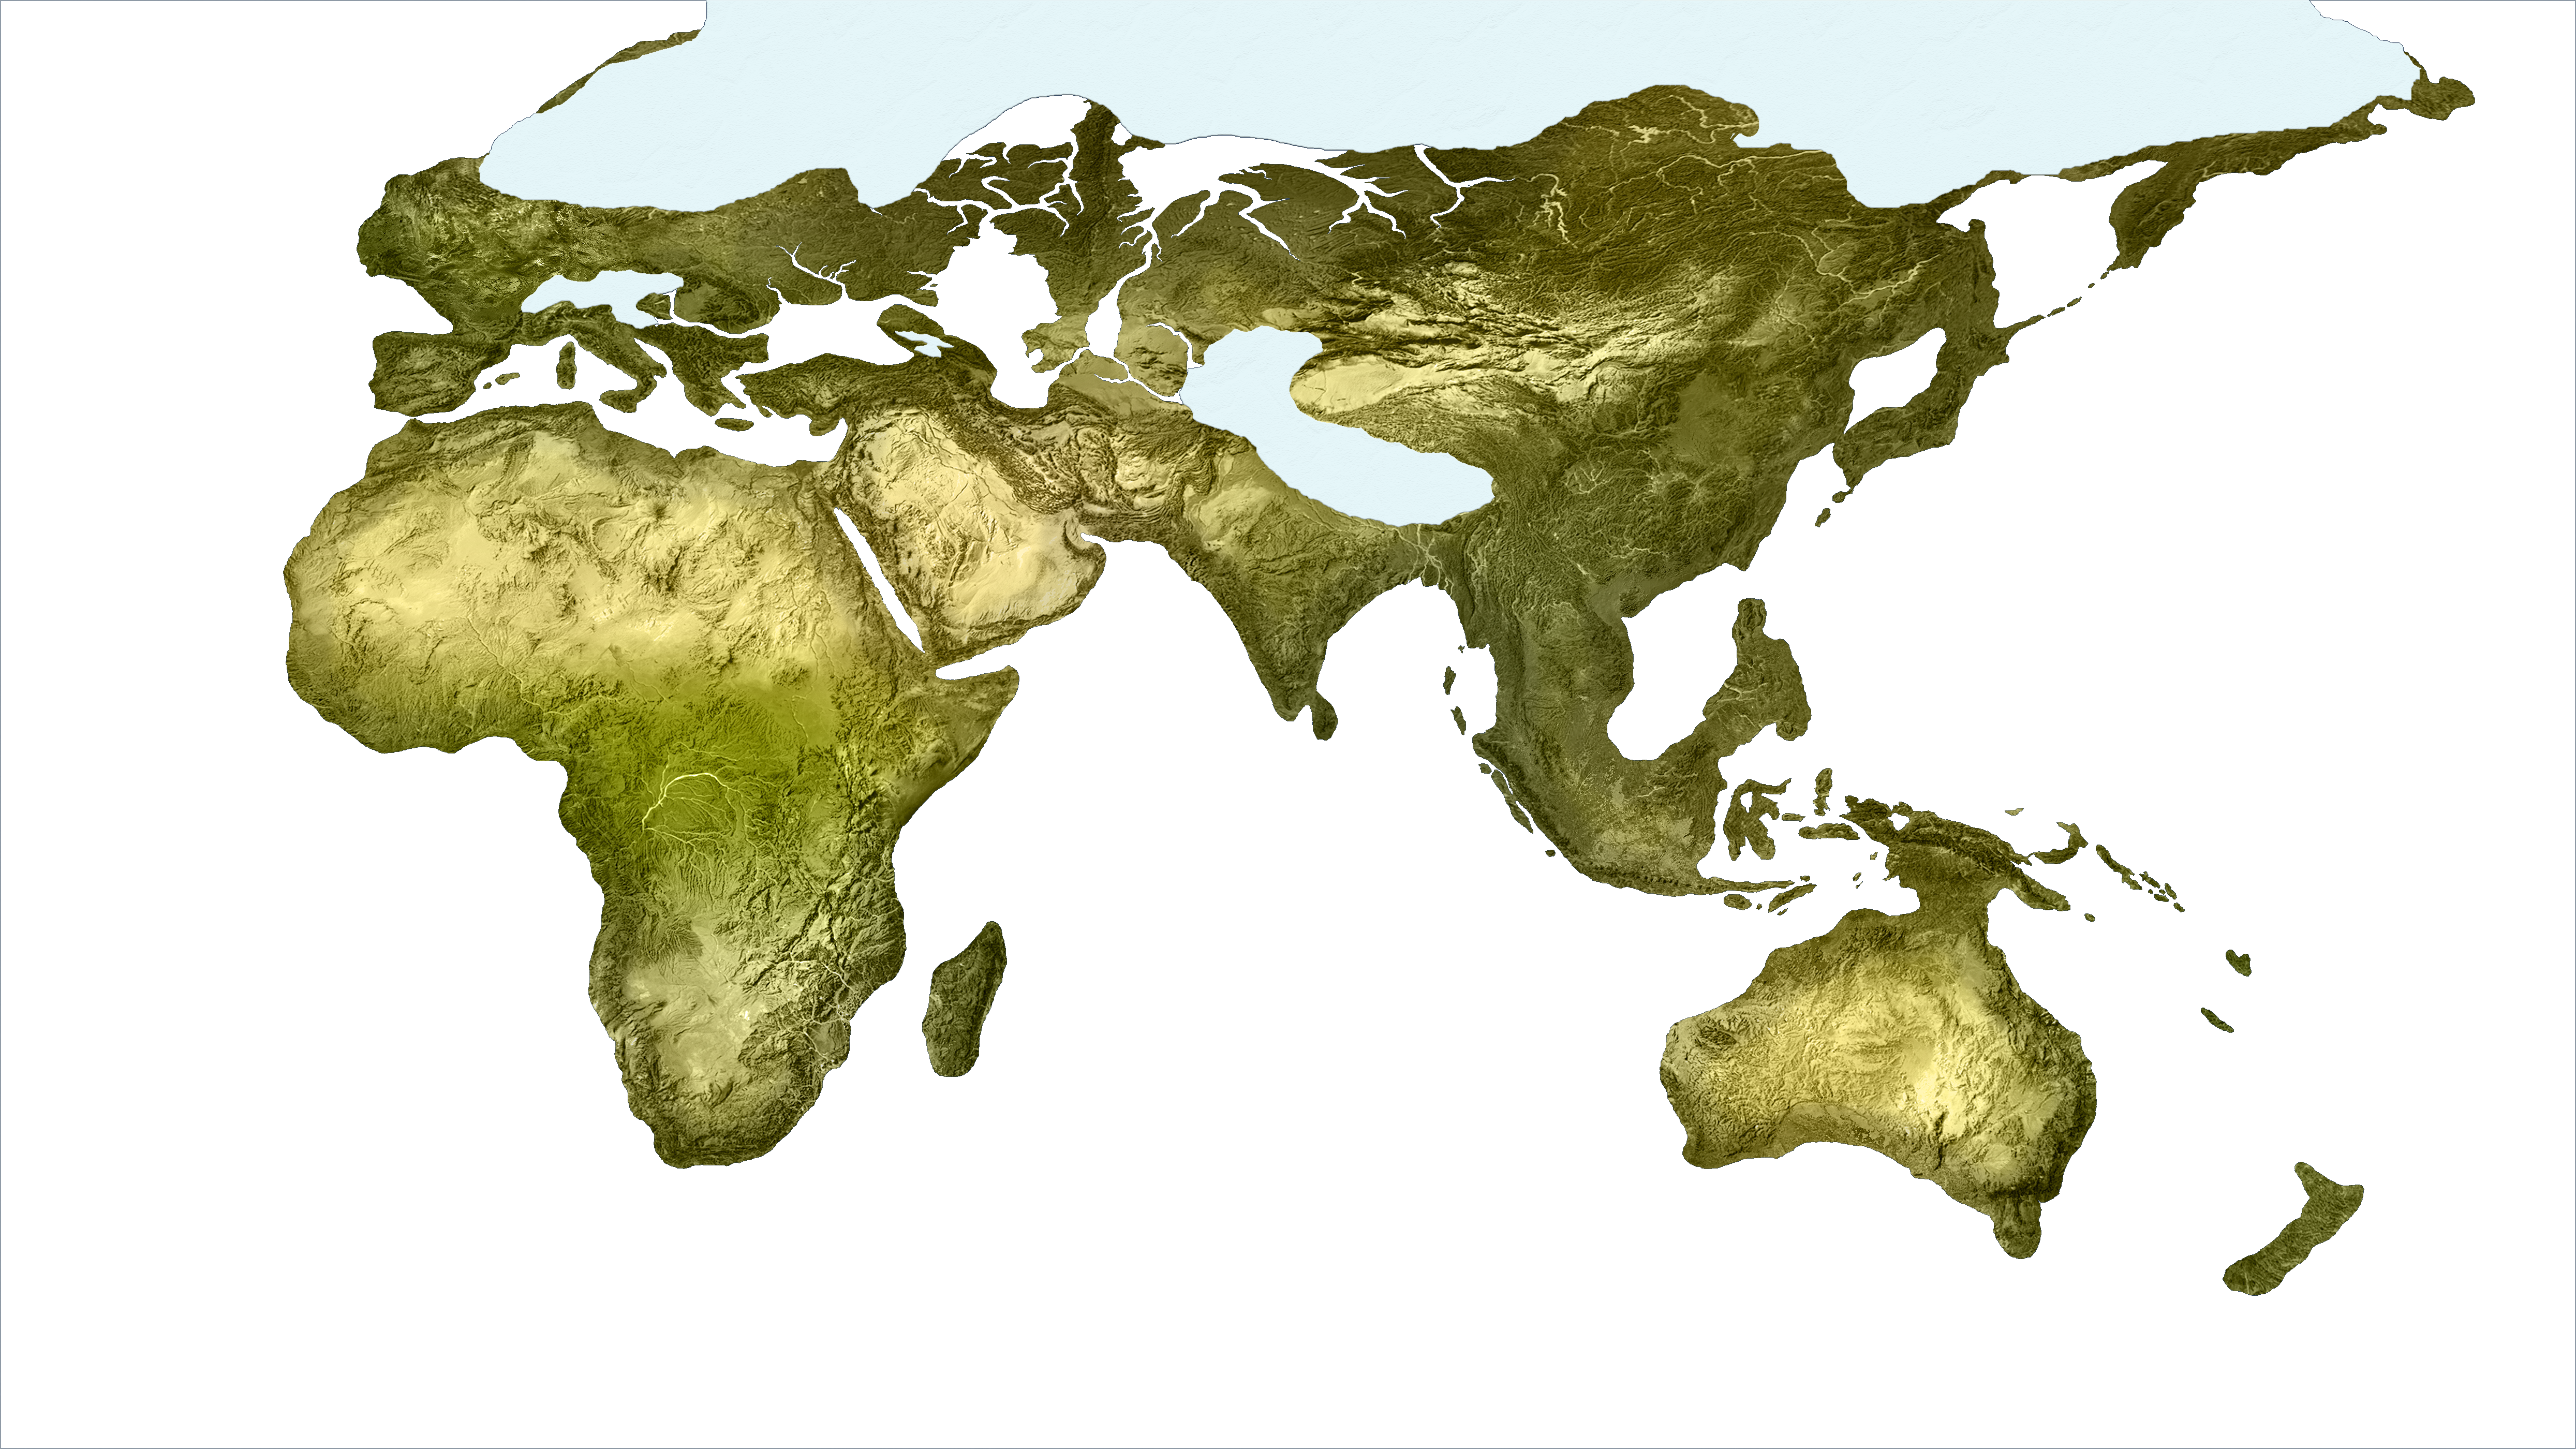
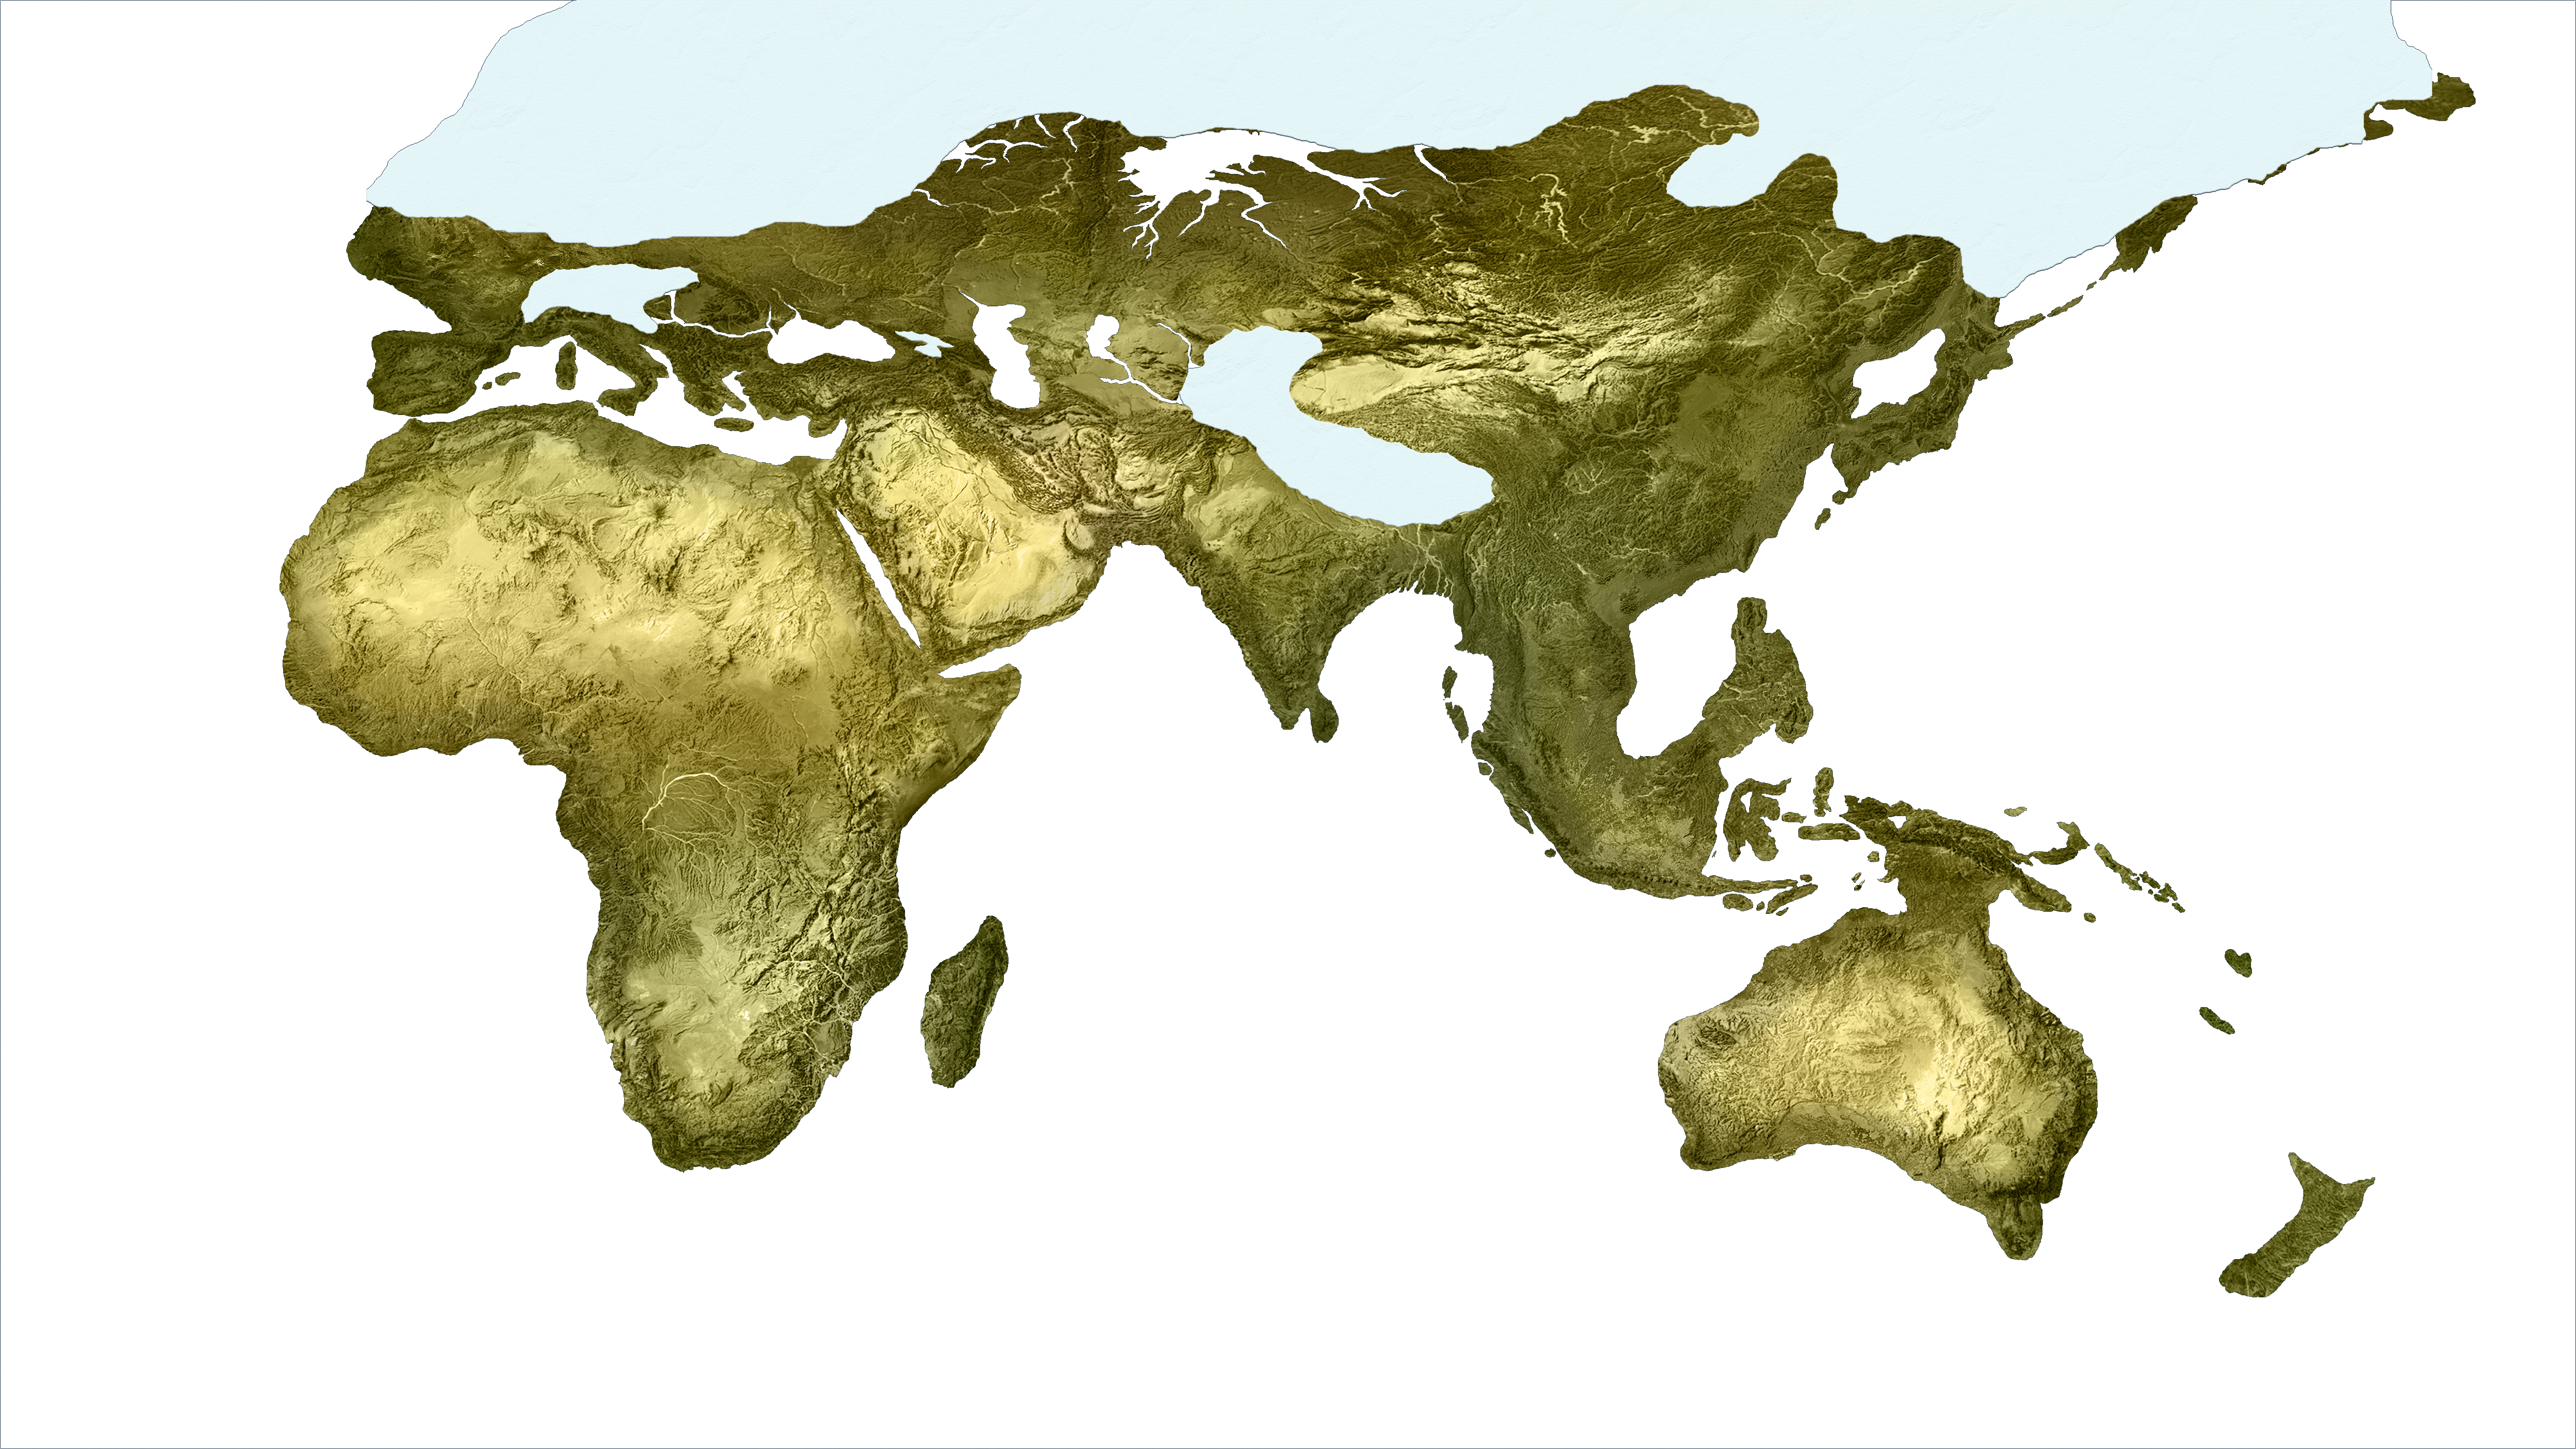
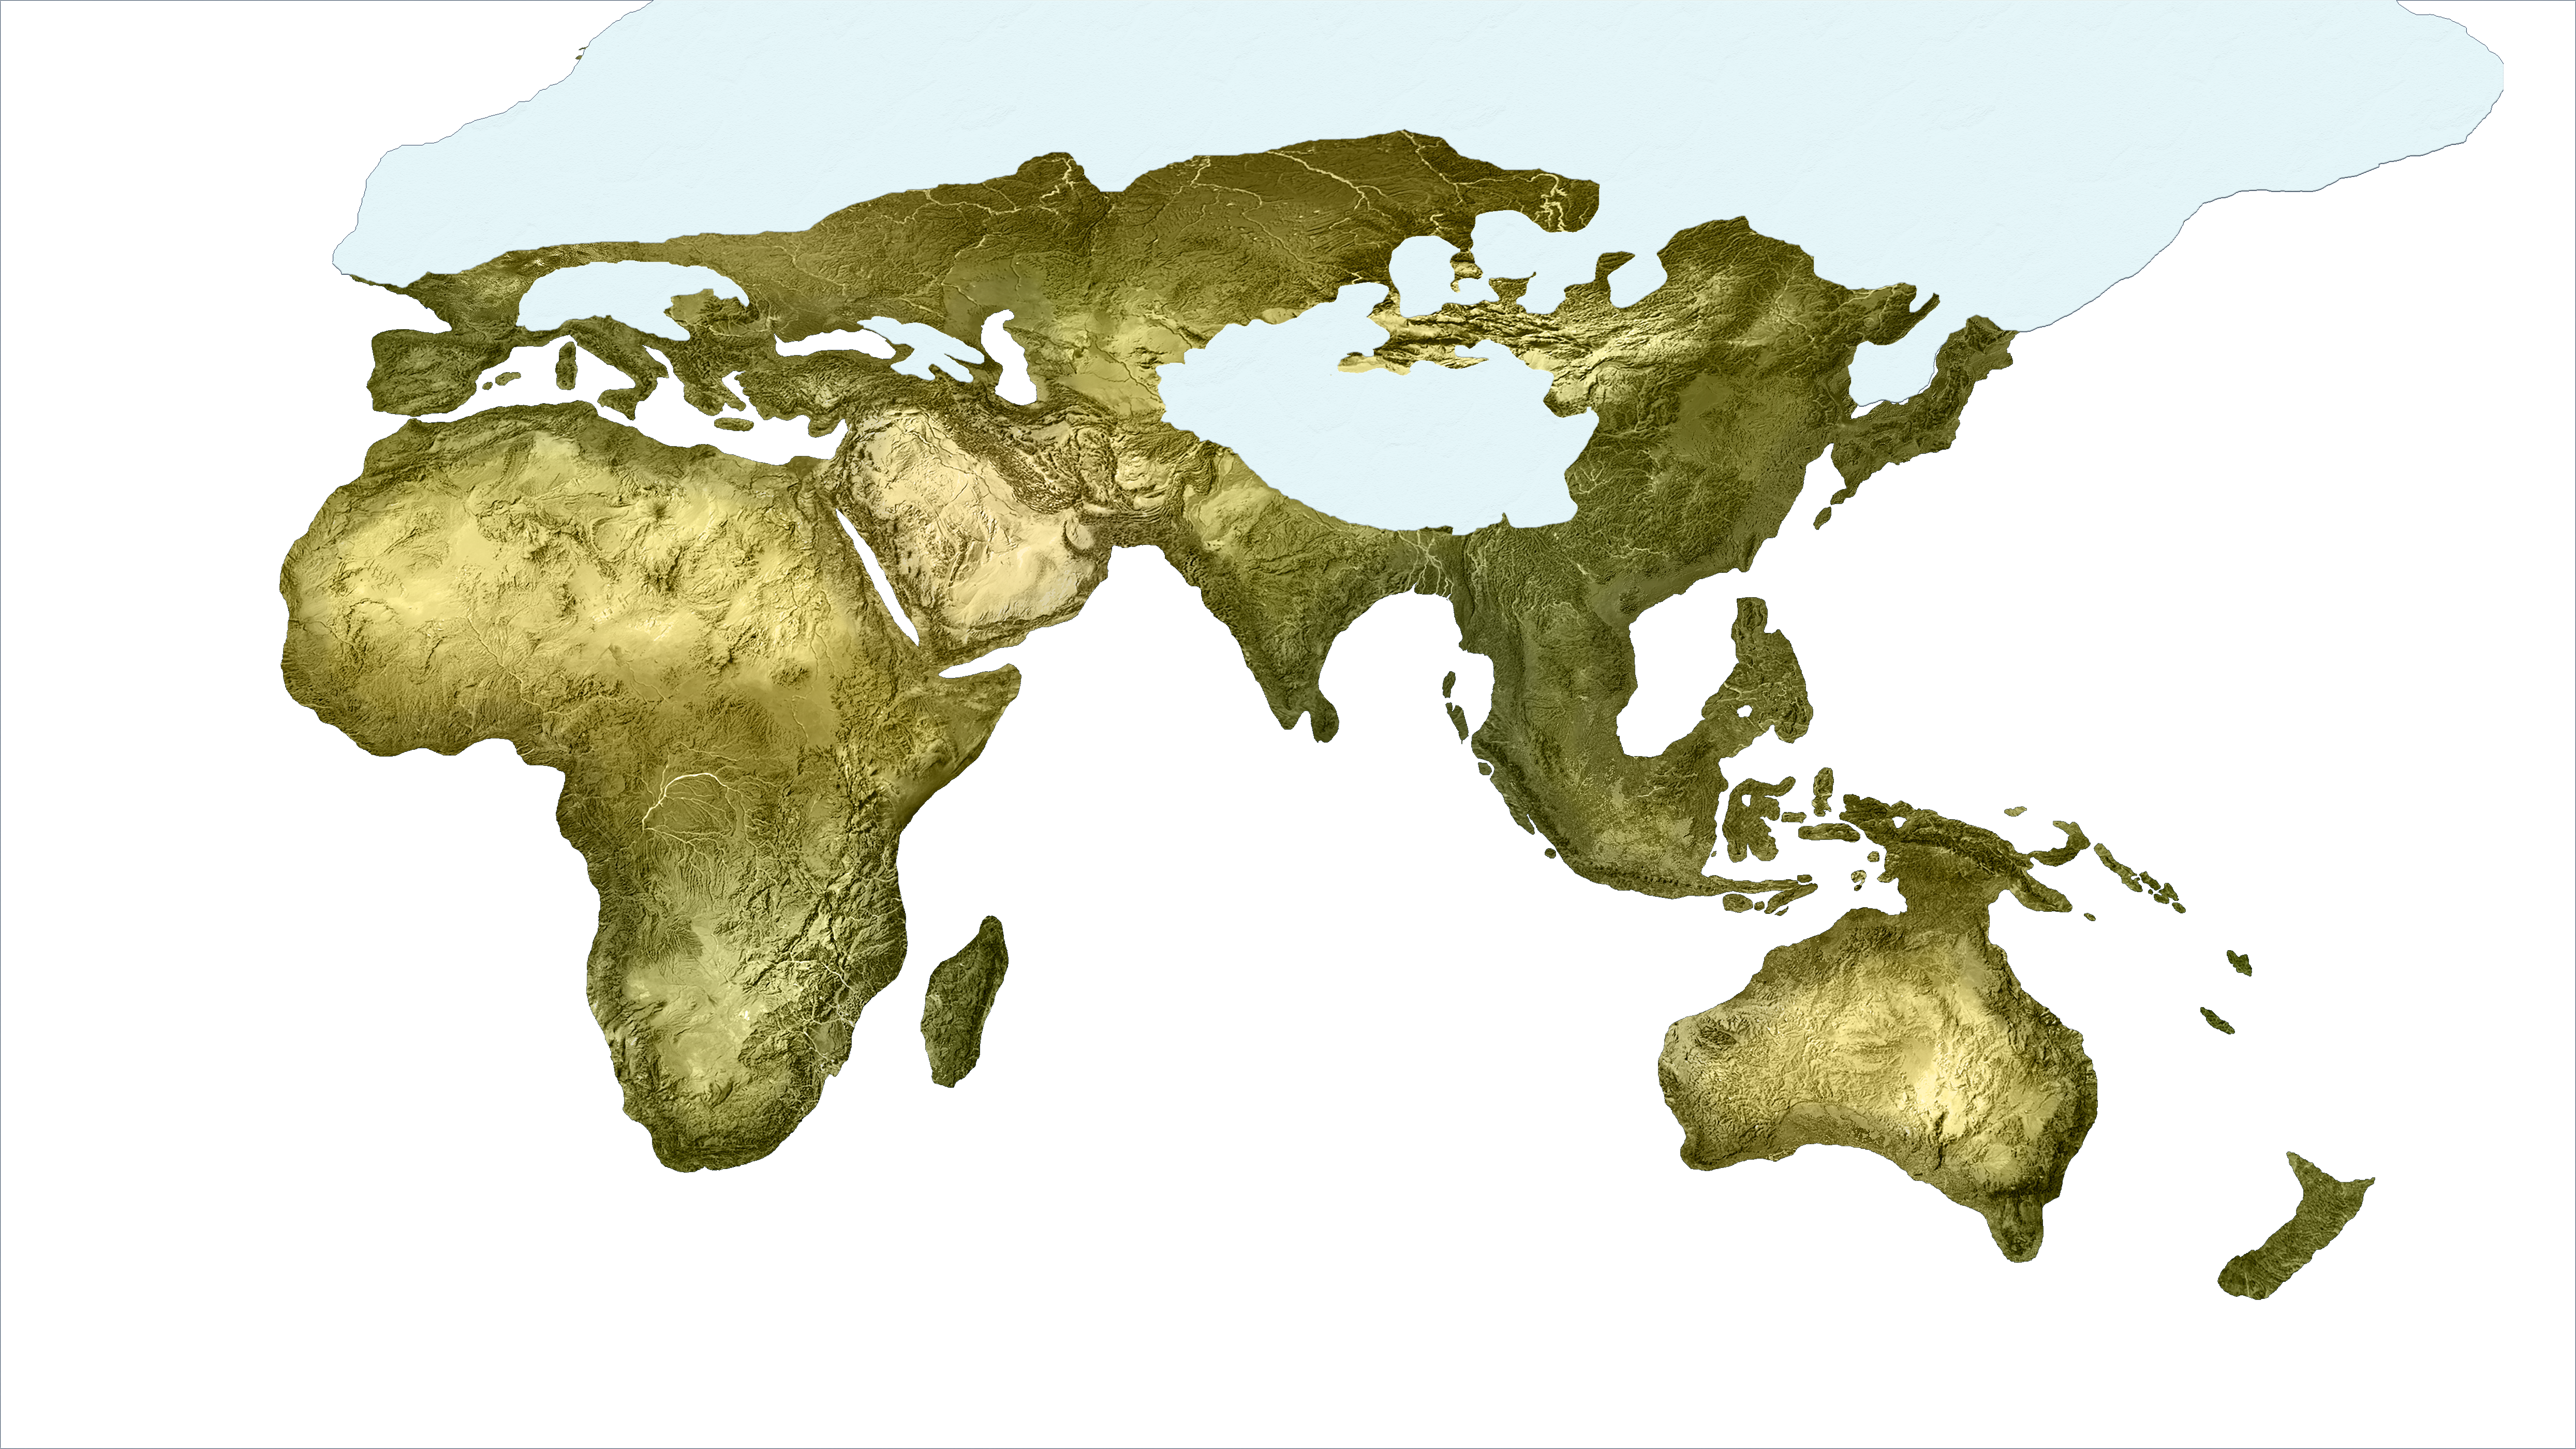
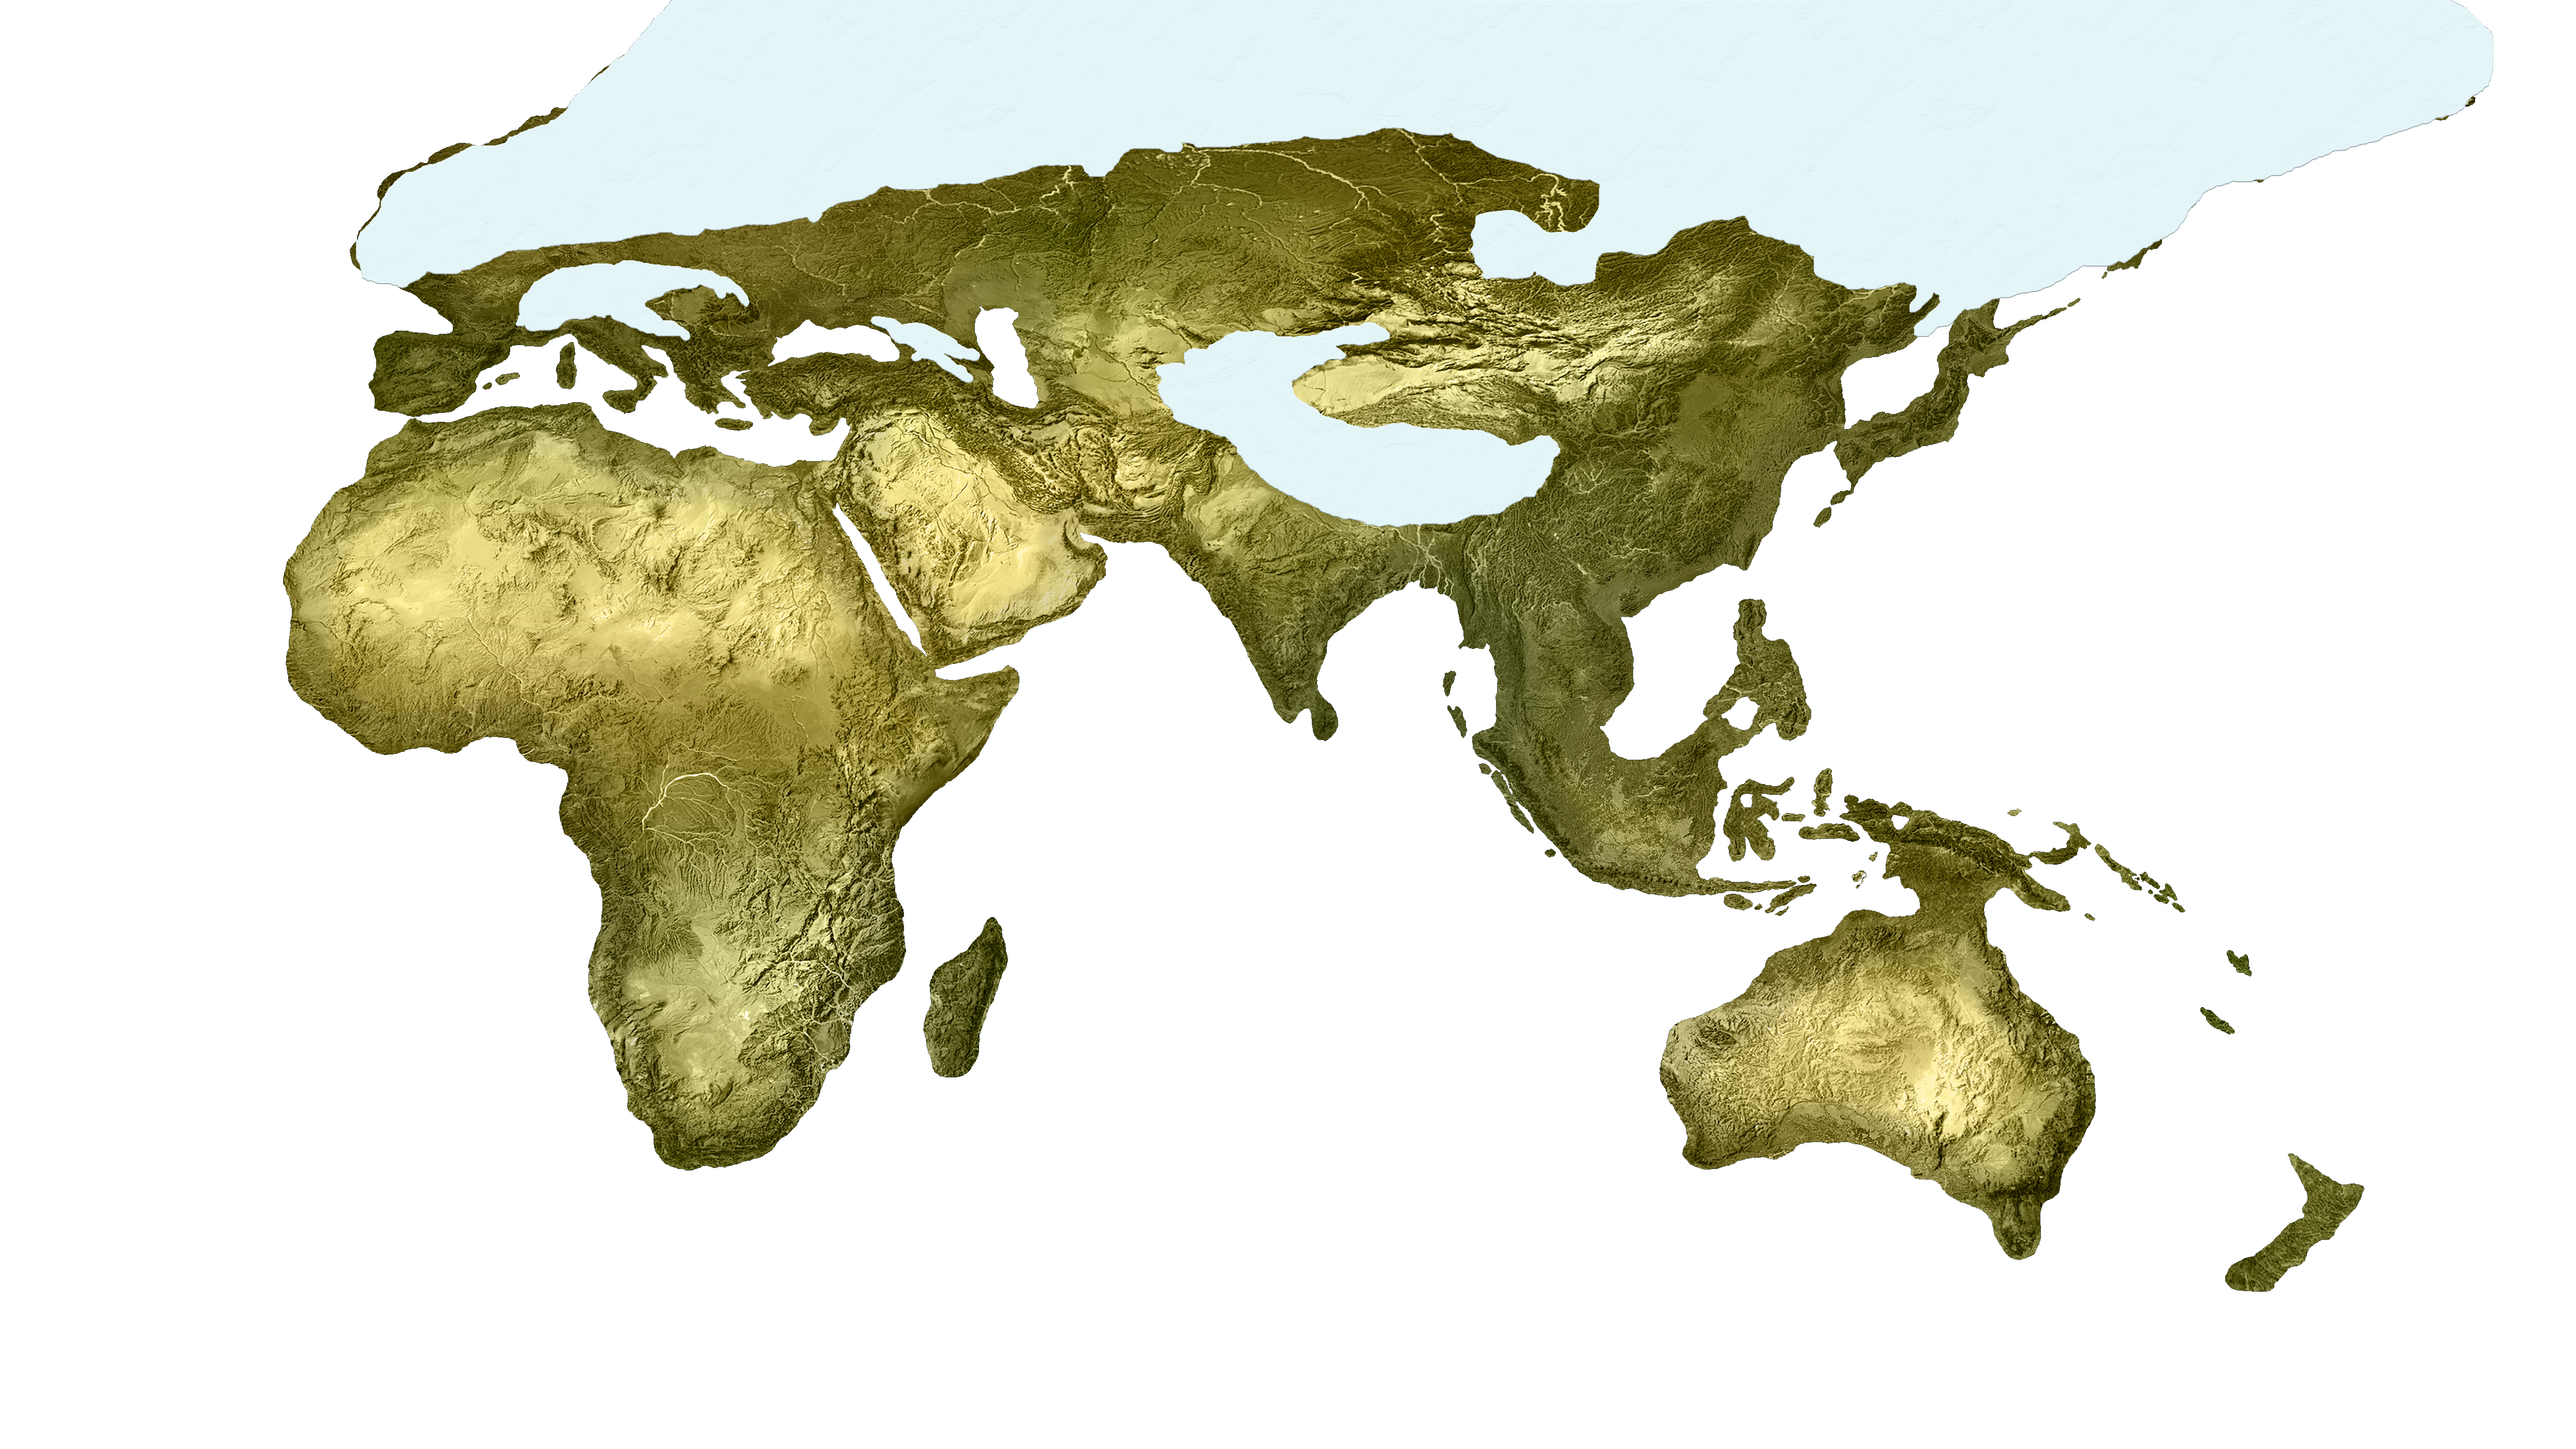
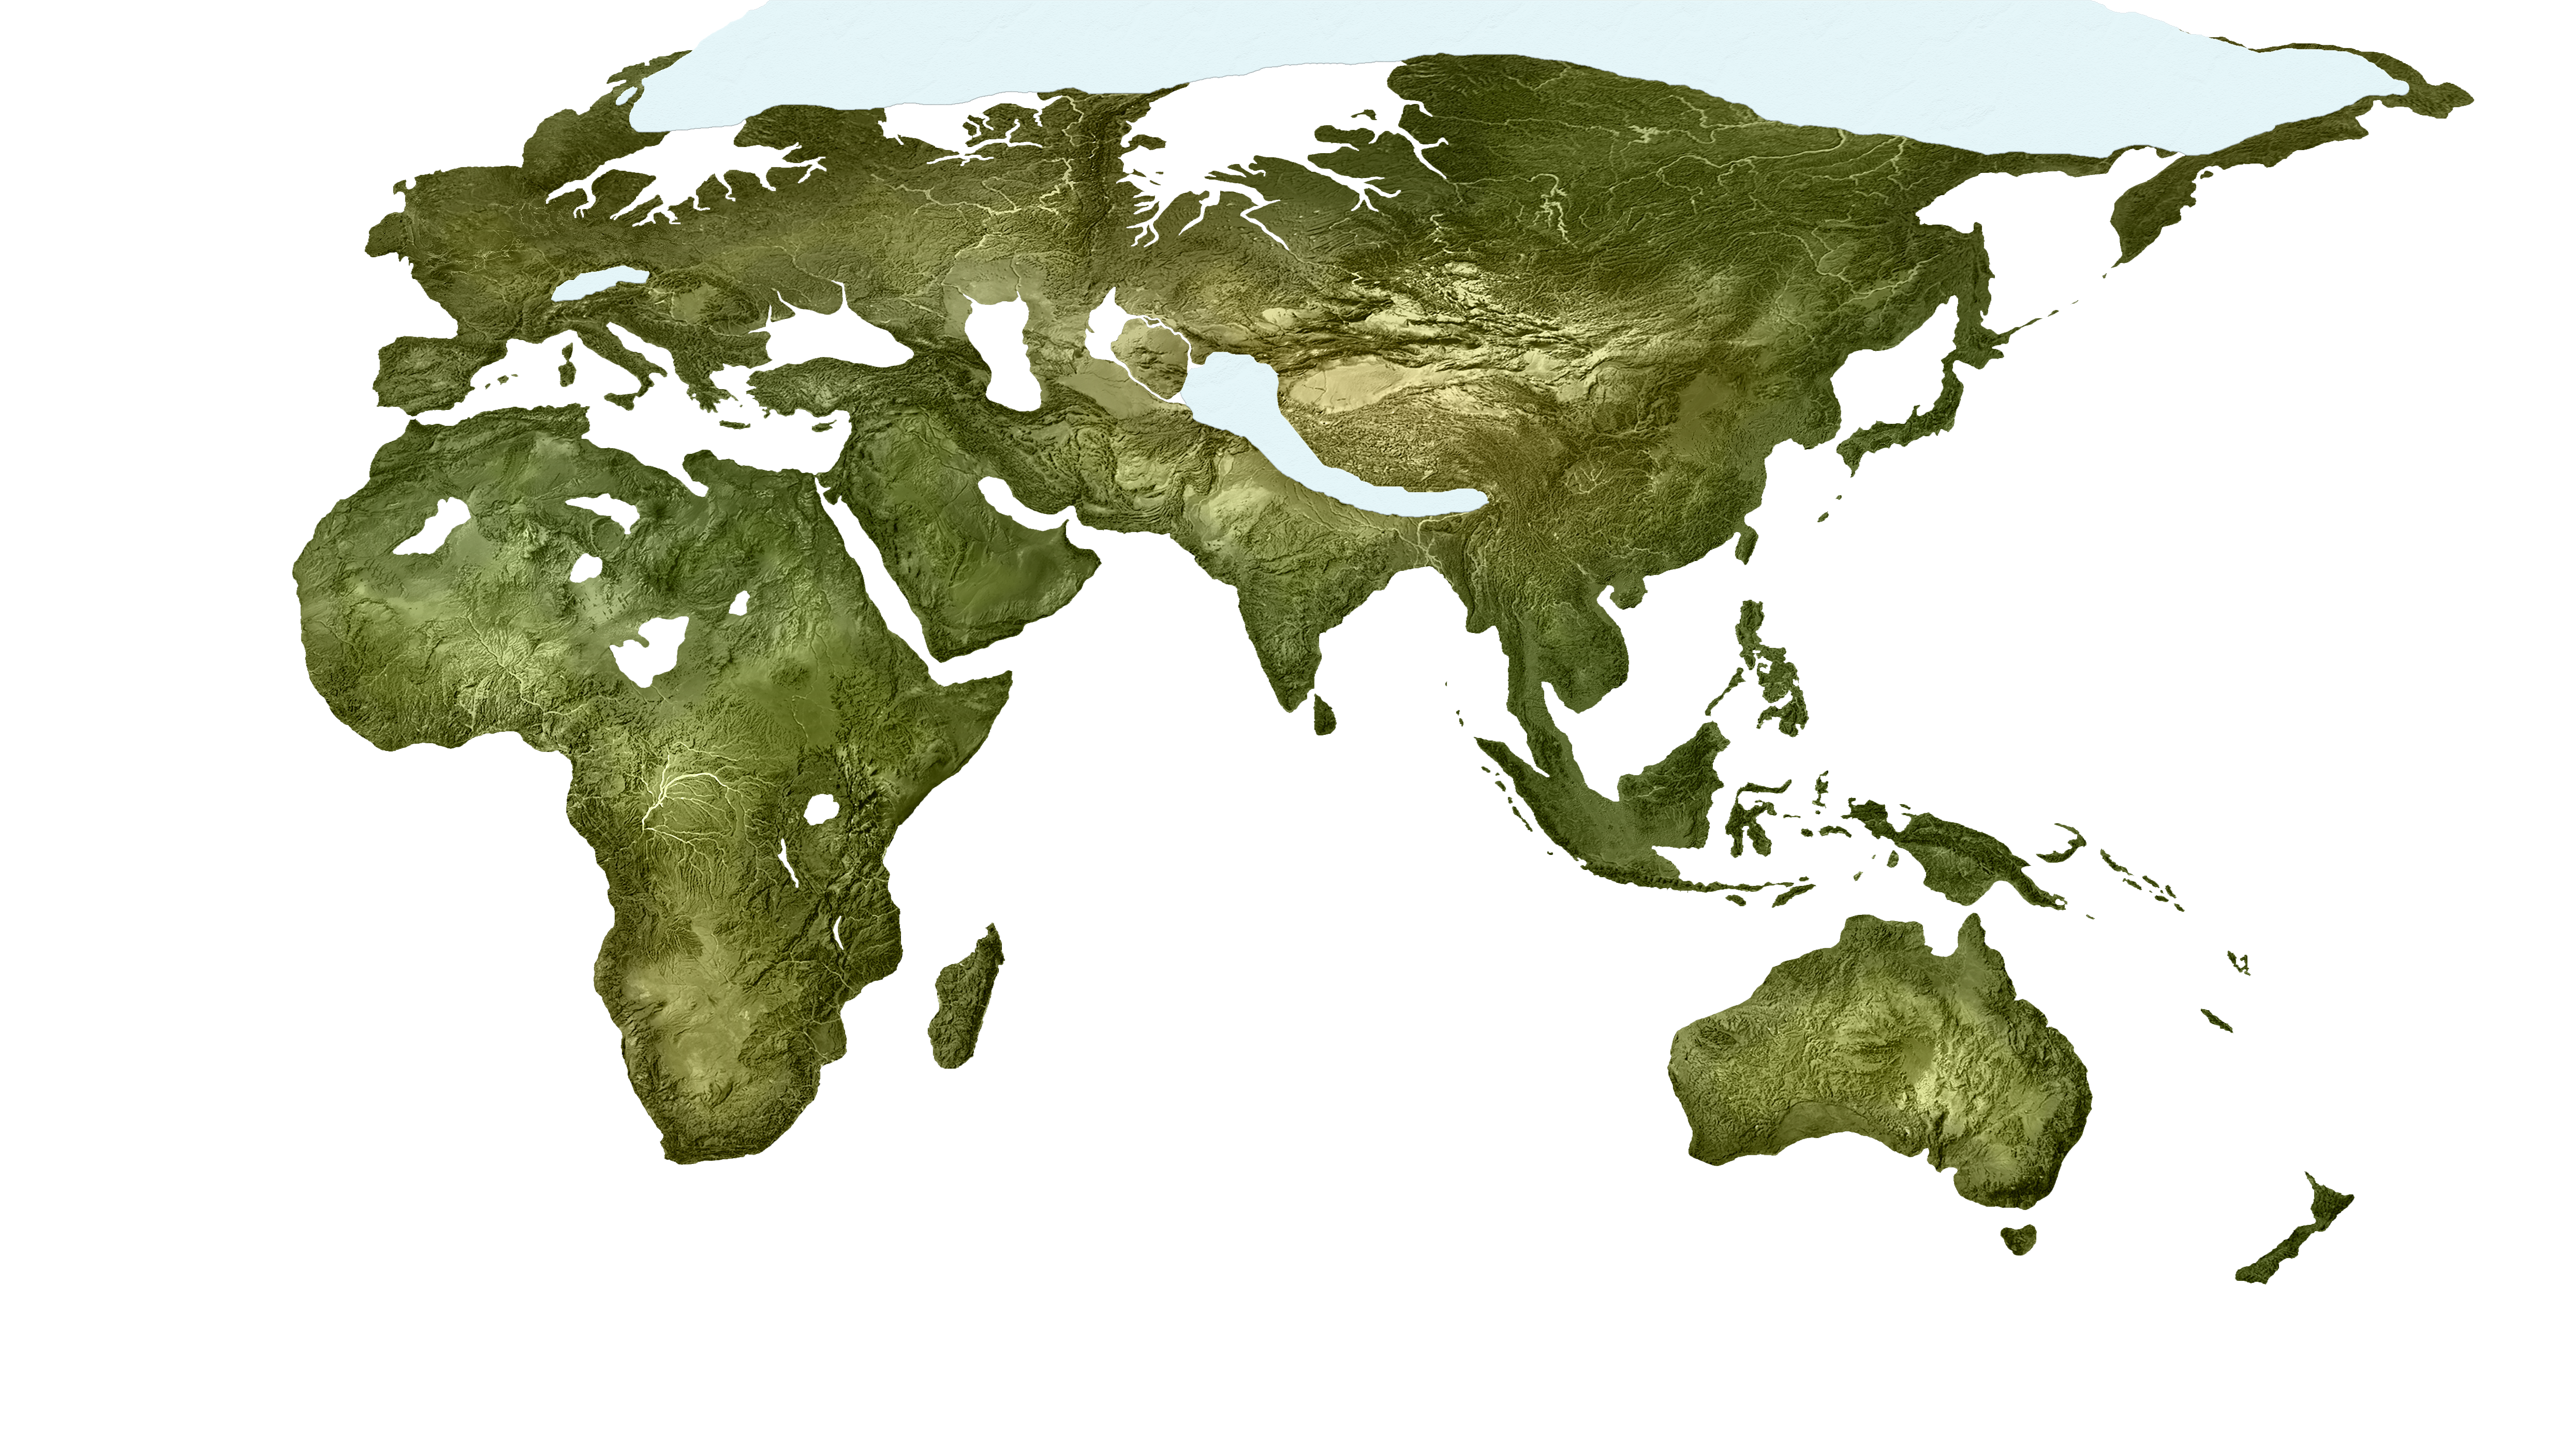
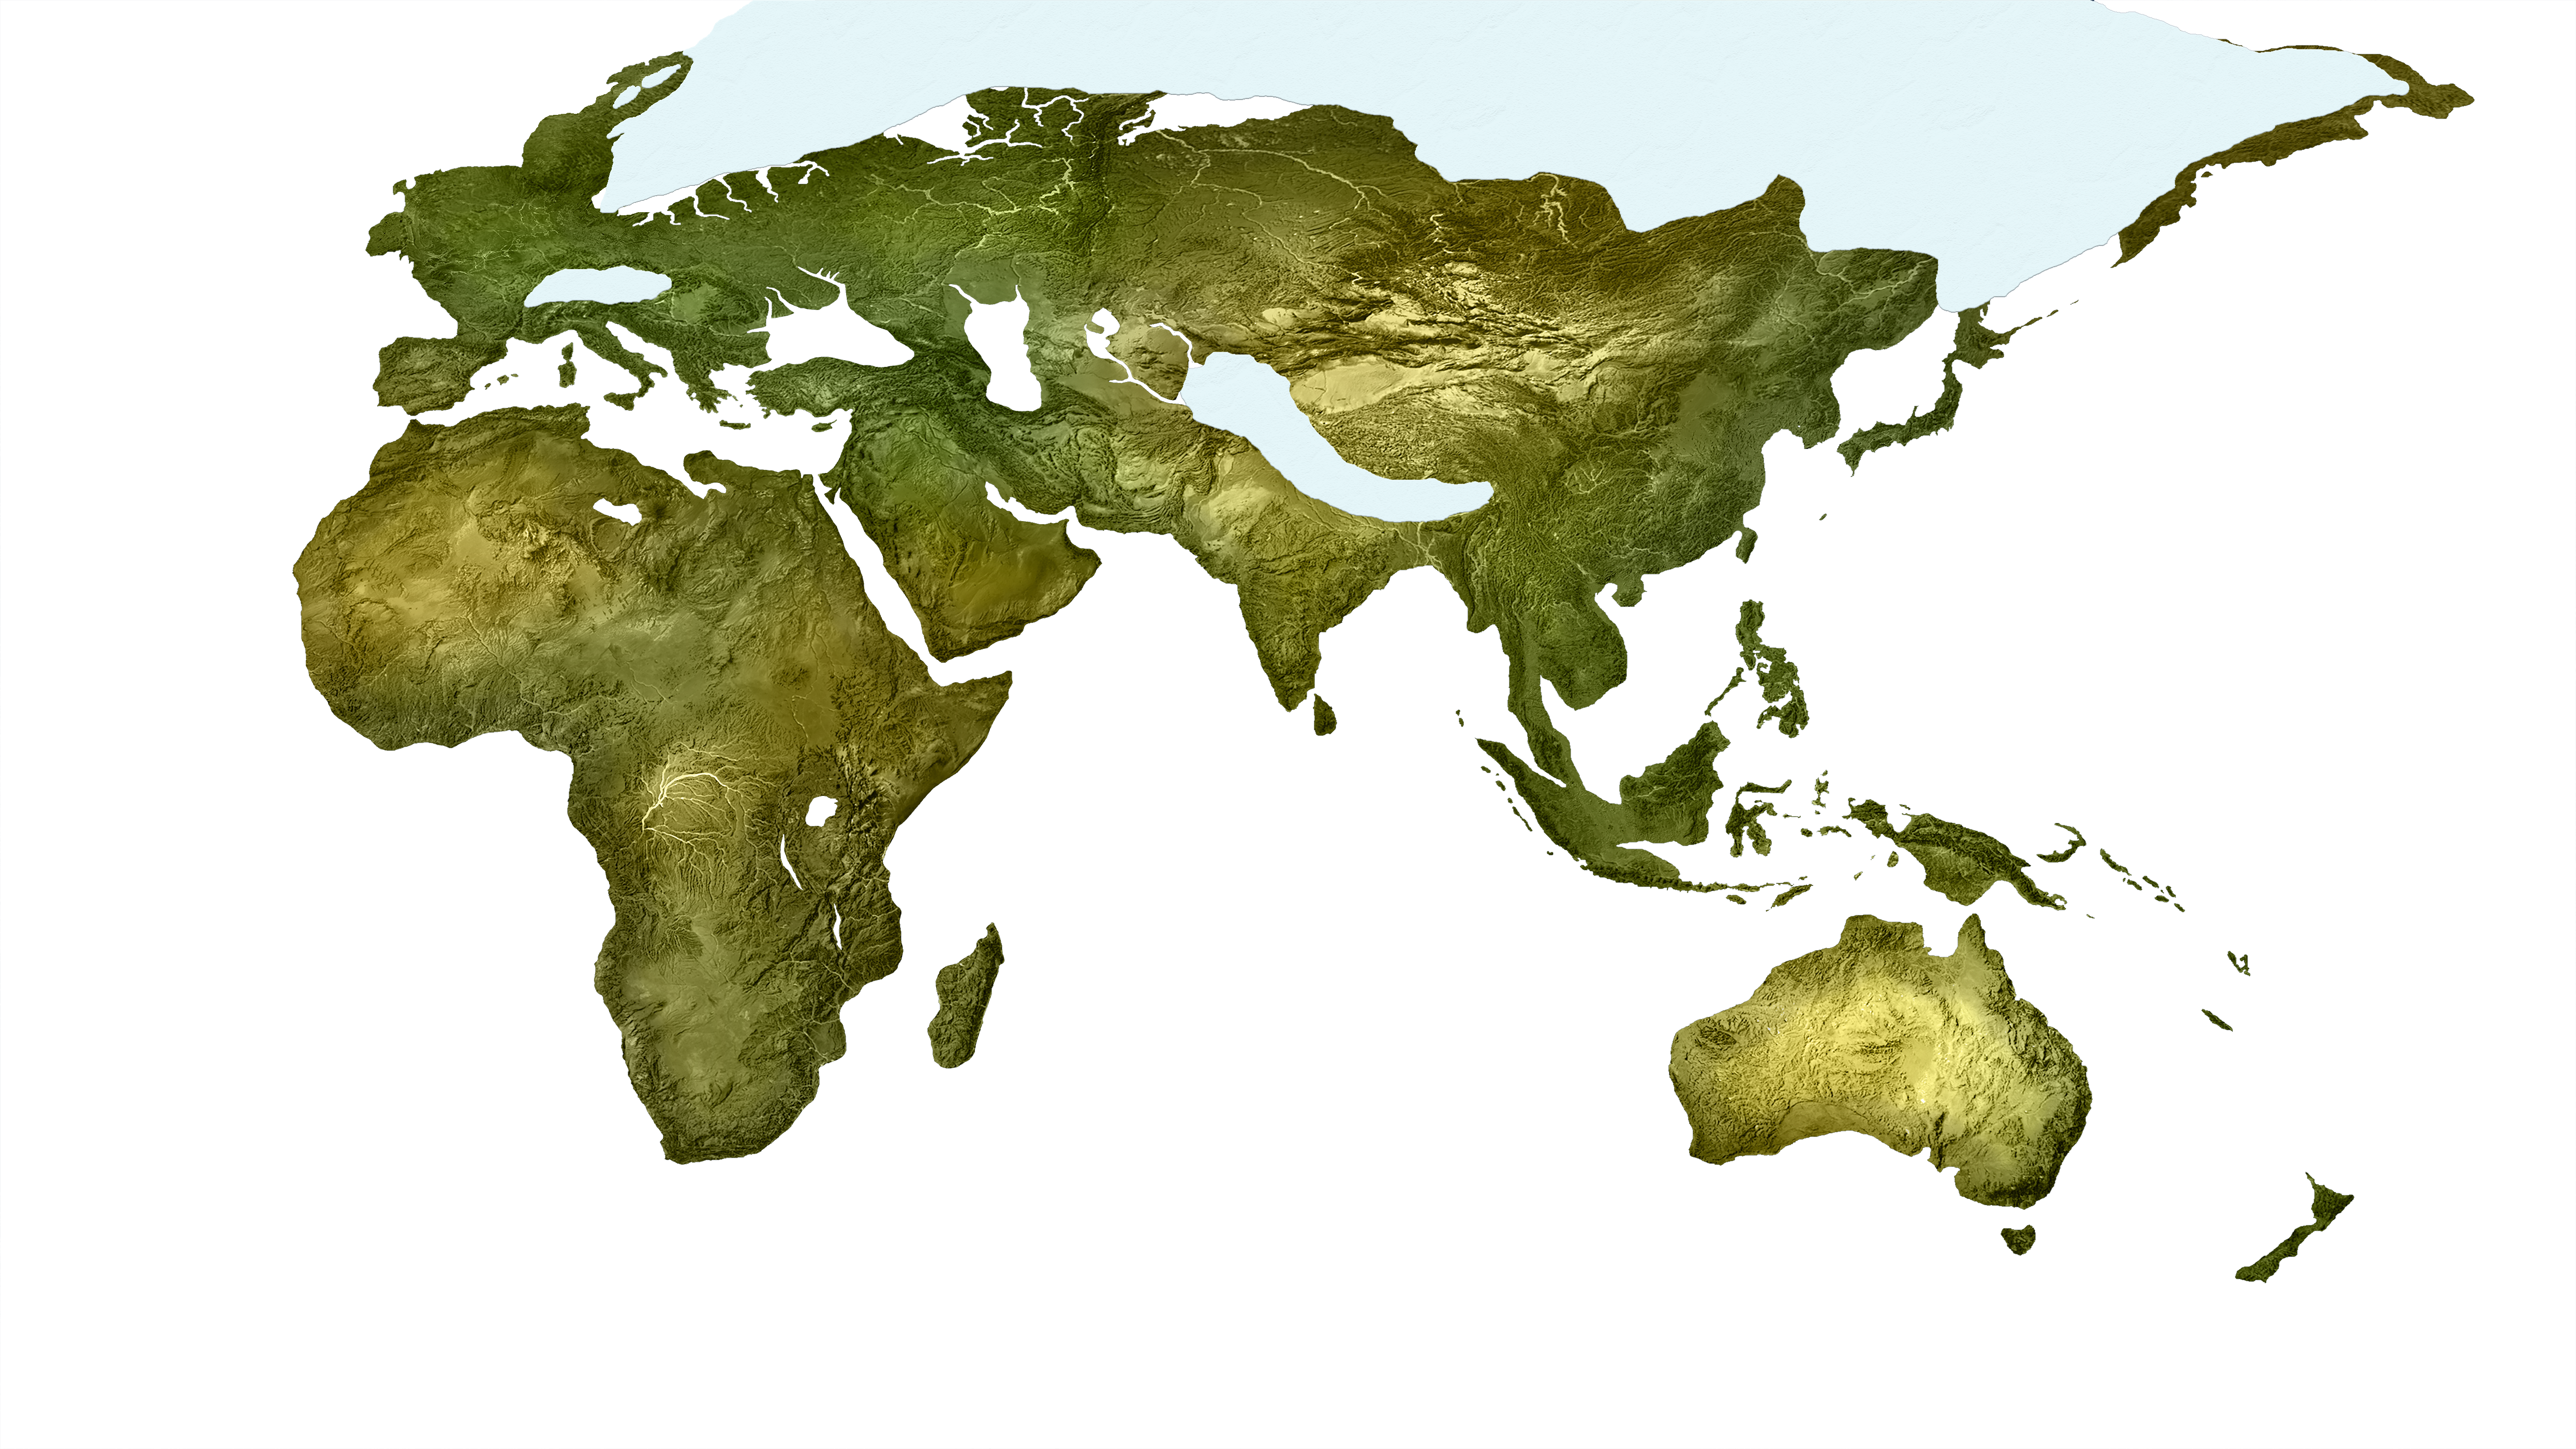
One of the ways in which changes in climate impact the people of the world is through sea level changes increasing or decreasing the amount of available land to live on. We can superimpose coastline maps to visualize changes in land area in the world. The first map below you shows the drop in sea levels from the Pagsian Turning to the First Tādhēskō. During the First Tādhēskō (64,560 BP to 54,100 BP) the dramatic increase in temperature led to a corresponding suddent increase in sea level, which is not shown in the maps below. The second map instead illustrates the subsequent drop in sea level and increase in land area from the Pluvial Turning through the end of the Srīgosian ice age. In each of these maps, sea levels are dropping and land area is increasing. Therefore, you should think of the color-coded bands as representing land area that was incrementally gained over time, moving outward from the initial smallest area shown.
Pagsian Turning to the First Tādhēskō
Pluvial Turning to the Second Tādhēskō
Second Tādhēskō to mid-Polwes Pleudō
Mid-Polwes Pleudō to the Meghalaian Turning
Case Study: Polwes Pleudō
One of the main features of the Second Tādhēskō was the formation of massive inland icewater lakes across Europe and Asia, caused by the rapid retreat of glaciers that had formed during the Srīgosian Turning. In Europe, however, there was a volcanic explosion that triggered a sort of "climate whiplash" across the continent: the Paukos Eisom followed by Polwes Pleudō.
7,410 BP: After Euxine Lake floods
8,225 BP: After the Storegga Tsunami
9,960 BP: After Ancylus Lake floods
10,220 BP: After Daganzi island forms
10,732 BP: After Ancyllus Lake forms
11,343 BP: After Lake Jokull drains
11,570 BP: Before Lake Jokull drains
11,730 BP: At the start of Polwes Pleudō
13,077 BP: At the start of Paukos Eisom
Part 2: Atmospheric Elements
Since the four-fold typology of turnings was introduced by Edward Kelley,1 there have been a number of analyses attempting to use scientific data to critique or validate, or test the limits of, this framework. We can illustrate this with two distinct analyses that have been applied to the three turnings that have been characterized as "golden ages" in the study of the turnings: the Pagsian Turning (127,840 BP - 113,700 BP), the Pluvial Turning (54,100 BP - 40,150 BP), and the Kara'apian Turning (11,700 BP - 4,213 BP).Temperature Anomalies
The graph of global temperature over time that appeared earlier, also shown below, codes the "golden age" turnings as yellow region on the timeline. Ever since scientifically established measurements of global temperature have been incorporated into research and discussion of the turnings, the obvious anomaly has drawn discussion: the Pluvial Turning (center golden segment) was not nearly as warm as the Pagsian Turning (left golden segment) or the Kara'apian Turning (right golden segment).
Global temperature over time
Moisture Oscillations
The tropical belt, comprised of the strip across northern Africa, the Levant and Arabia, and western Asia, has shown an unusual sensitivity to changes in moisture levels across the turnings. As a result, moisture and airidity in this region can also be used to illustrate the four-part cycle of types of turnings originally proposed in Mackenzie's Taxonomy: Golden Age, Decline, Ice Age, and Recovery. The image below shows the oscillations in airidity and moisture of the tropical belt. The vertical axis shows the sequence of turning types, while the horizontal axis shows iterations of each cycle. The first column, from top to bottom, shows: the Pagsian Turning (golden age), Recosian Turning (decline), Ougrosian Turning (ice age), and the First Tādhēskō (recovery). The second column, from top to bottom, shows: the Pluvial Turning (golden age), Sṇterían Turning (decline), Srīgosian Turning (ice age), and the Second Tādhēskō (recovery). The third column, starting at the top, shows the Kara'apian Turning (golden age) and the Meghalaian Turning (decline), which is the current turning of the world.2